
The Dashboard Claude Code Deserves
Real-time monitoring • Budget alerts • Conversation viewer • FTS5 search • Security audit • Web UI
View Architecture Diagram

Everything You Need to Monitor Claude Code
Cost Tracking
Budget alerts, 30-day forecasting, billing blocks
Session Monitoring
Live processes with context pressure bar, CPU/RAM/Tokens, compaction detection, search, conversation replay
Config Management
4-level merge, hooks, agents, MCP servers
Security Audit
Cross-session violations feed, destructive command detection, credential exposure alerts
View all 13 tabs in detail →
Dashboard
Overview stats, model usage, MCP servers, 30-day activity heatmap (responsive), API usage estimation with plan budgets.
Sessions
Browse all sessions with search, live Claude processes with CPU/RAM/Tokens, conversation replay with tool call visualization.
Conversation Viewer
Full JSONL replay with tool call visualization (grouped, collapsible), regex search with hit navigation, HTML export with syntax highlighting (40+ languages).
Search
FTS5 full-text search across all sessions with search-as-you-type, detail pane (date, project, snippet), arrow-key navigation, and conversation jump.
Config
Cascading configuration editor (global/project/local) with 4-column diff view.
Hooks
Event-based hook management with bash syntax highlighting and test mode.
Agents
Browse agents, commands, and skills with frontmatter YAML parsing and invocation stats.
Costs
Budget quota gauge with 4-level alerts (Safe/Warning/Critical/Exceeded), MTD cost, monthly projection, billing blocks export.
History
Full-text search across sessions with temporal patterns, filters, and CSV/JSON export.
MCP
Server management with status detection and env vars display.
Analytics
Advanced analytics: responsive activity heatmap, trends, patterns, summary, anomalies, costs, discover. 7 sub-views adapting to terminal width.
Audit Log
Security audit tab: per-session file/bash/network tool calls, cross-session violations feed sorted Critical→Warning→Info with remediation hints.
Plugins
Plugin usage analytics: invocation counts, token consumption, and extension stats across all sessions.
Brain
Cross-session knowledge base: hooks auto-extract progress, decisions, blockers, patterns, and fixes into a searchable SQLite store. Context injected at session start.
Instant Startup, Even With Thousands of Sessions
Claude Code stores every session as a JSONL file in ~/.claude.
After a few months, you accumulate thousands of files and gigabytes of data.
ccboard solves this with a local SQLite cache: it scans your files once, then loads from cache on every subsequent launch.
How it works under the hood →
| Scenario | What happens | Time |
|---|---|---|
| First launch | Scans all JSONL files, builds SQLite cache | ~20s (one-time) |
| Every next launch | Loads from cache, re-parses only changed files | 224ms |
| New session created | File watcher detects change, updates cache incrementally | <500ms |
- SQLite with WAL mode: concurrent reads while writing
- mtime-based invalidation: only re-parse files that actually changed
- Metadata-only scan: full session content loaded on-demand
- Parallel directory scanning: multiple project folders scanned concurrently
See It In Action
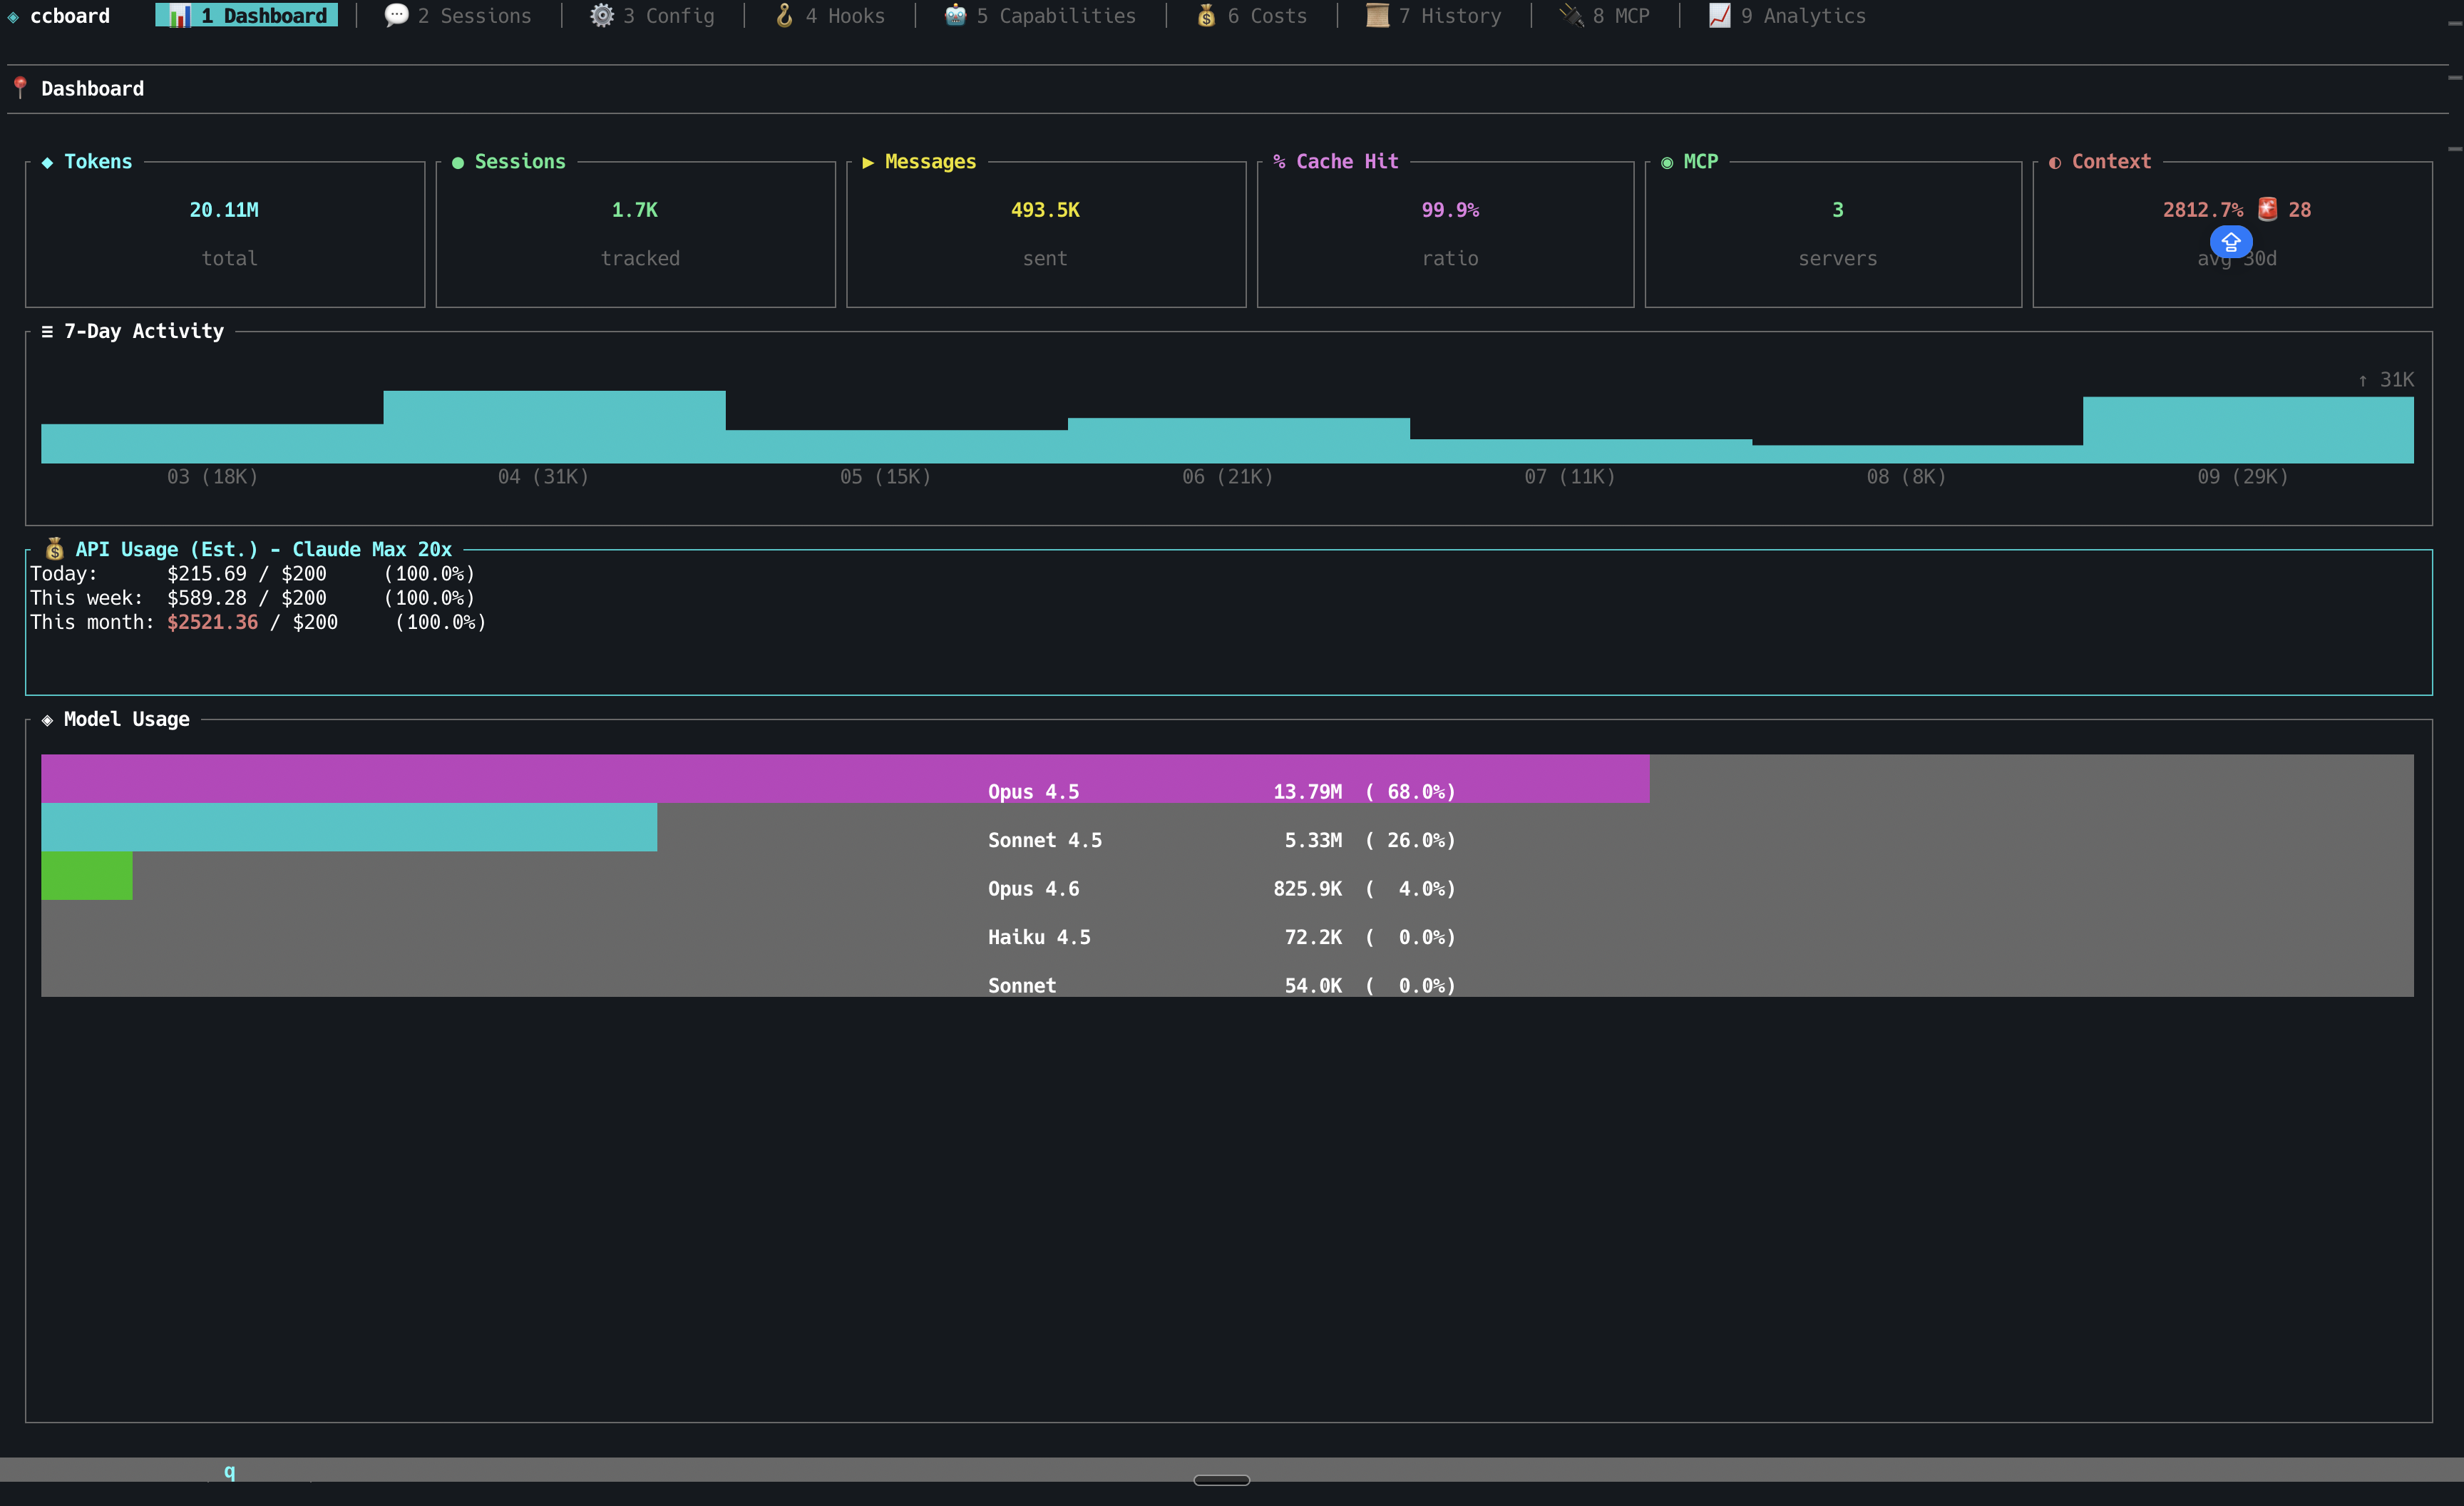
Dashboard with overview stats and 7-day activity
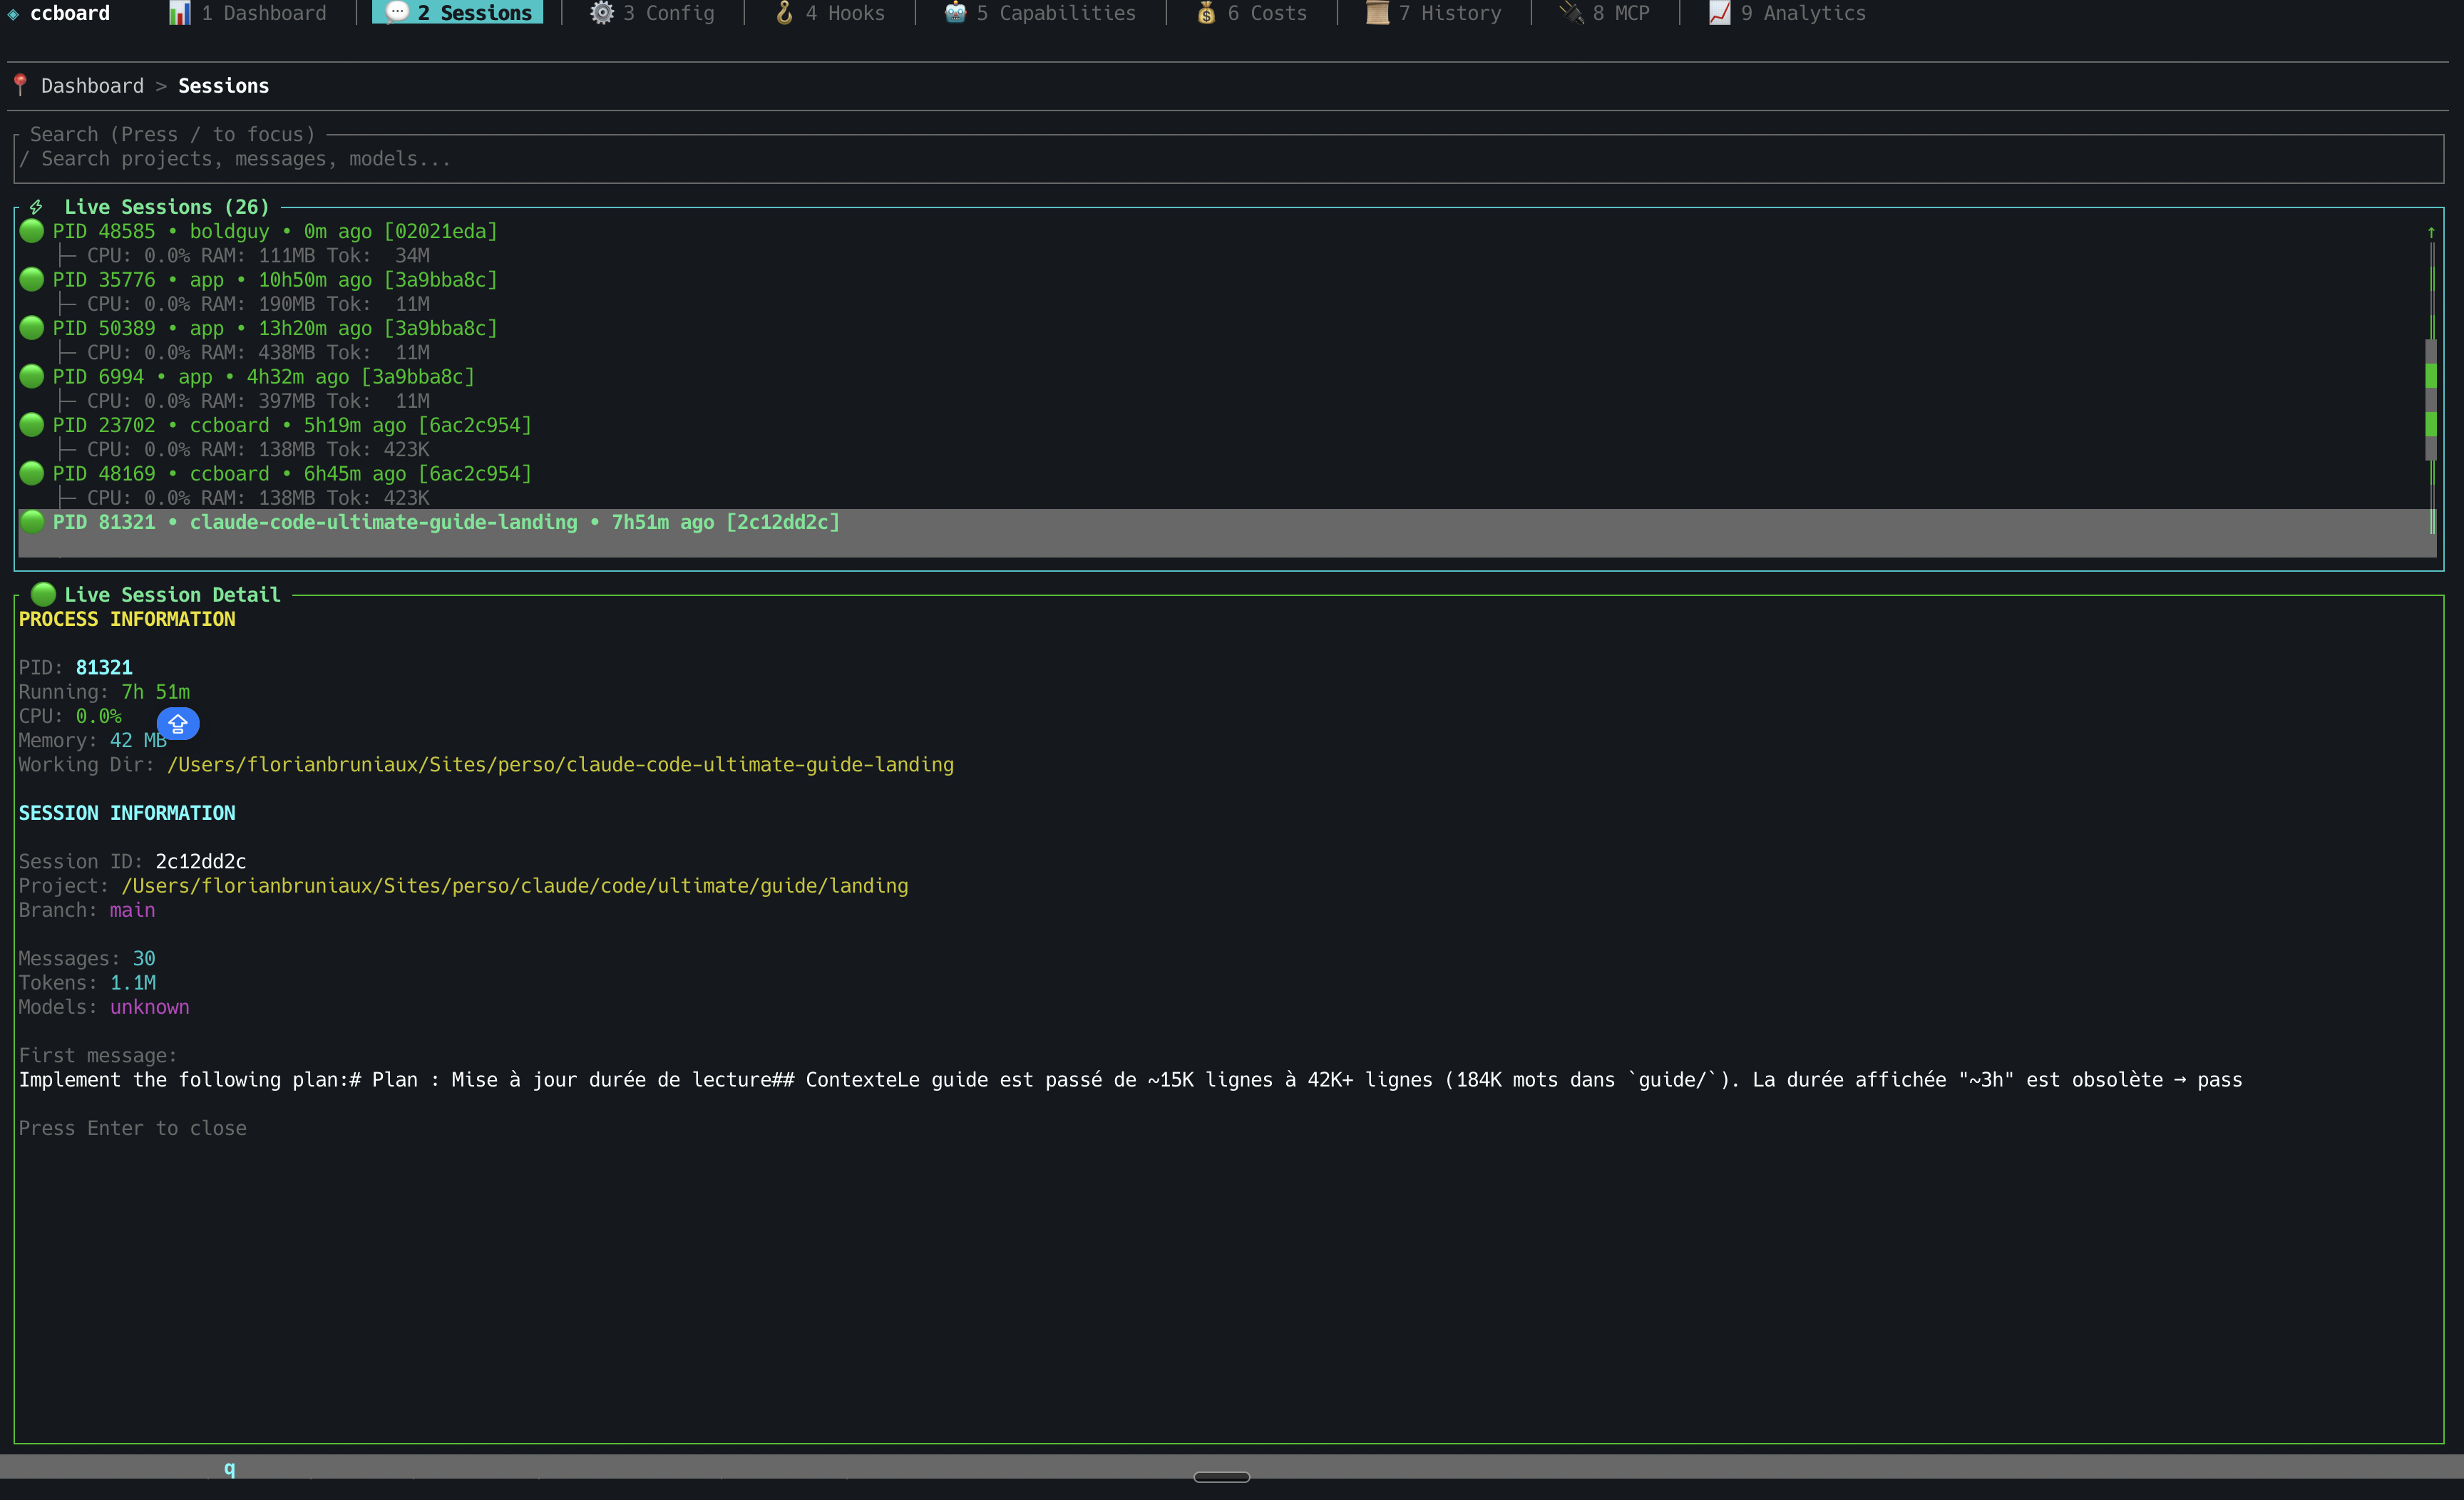
Sessions browser with live CPU/RAM/Tokens monitoring
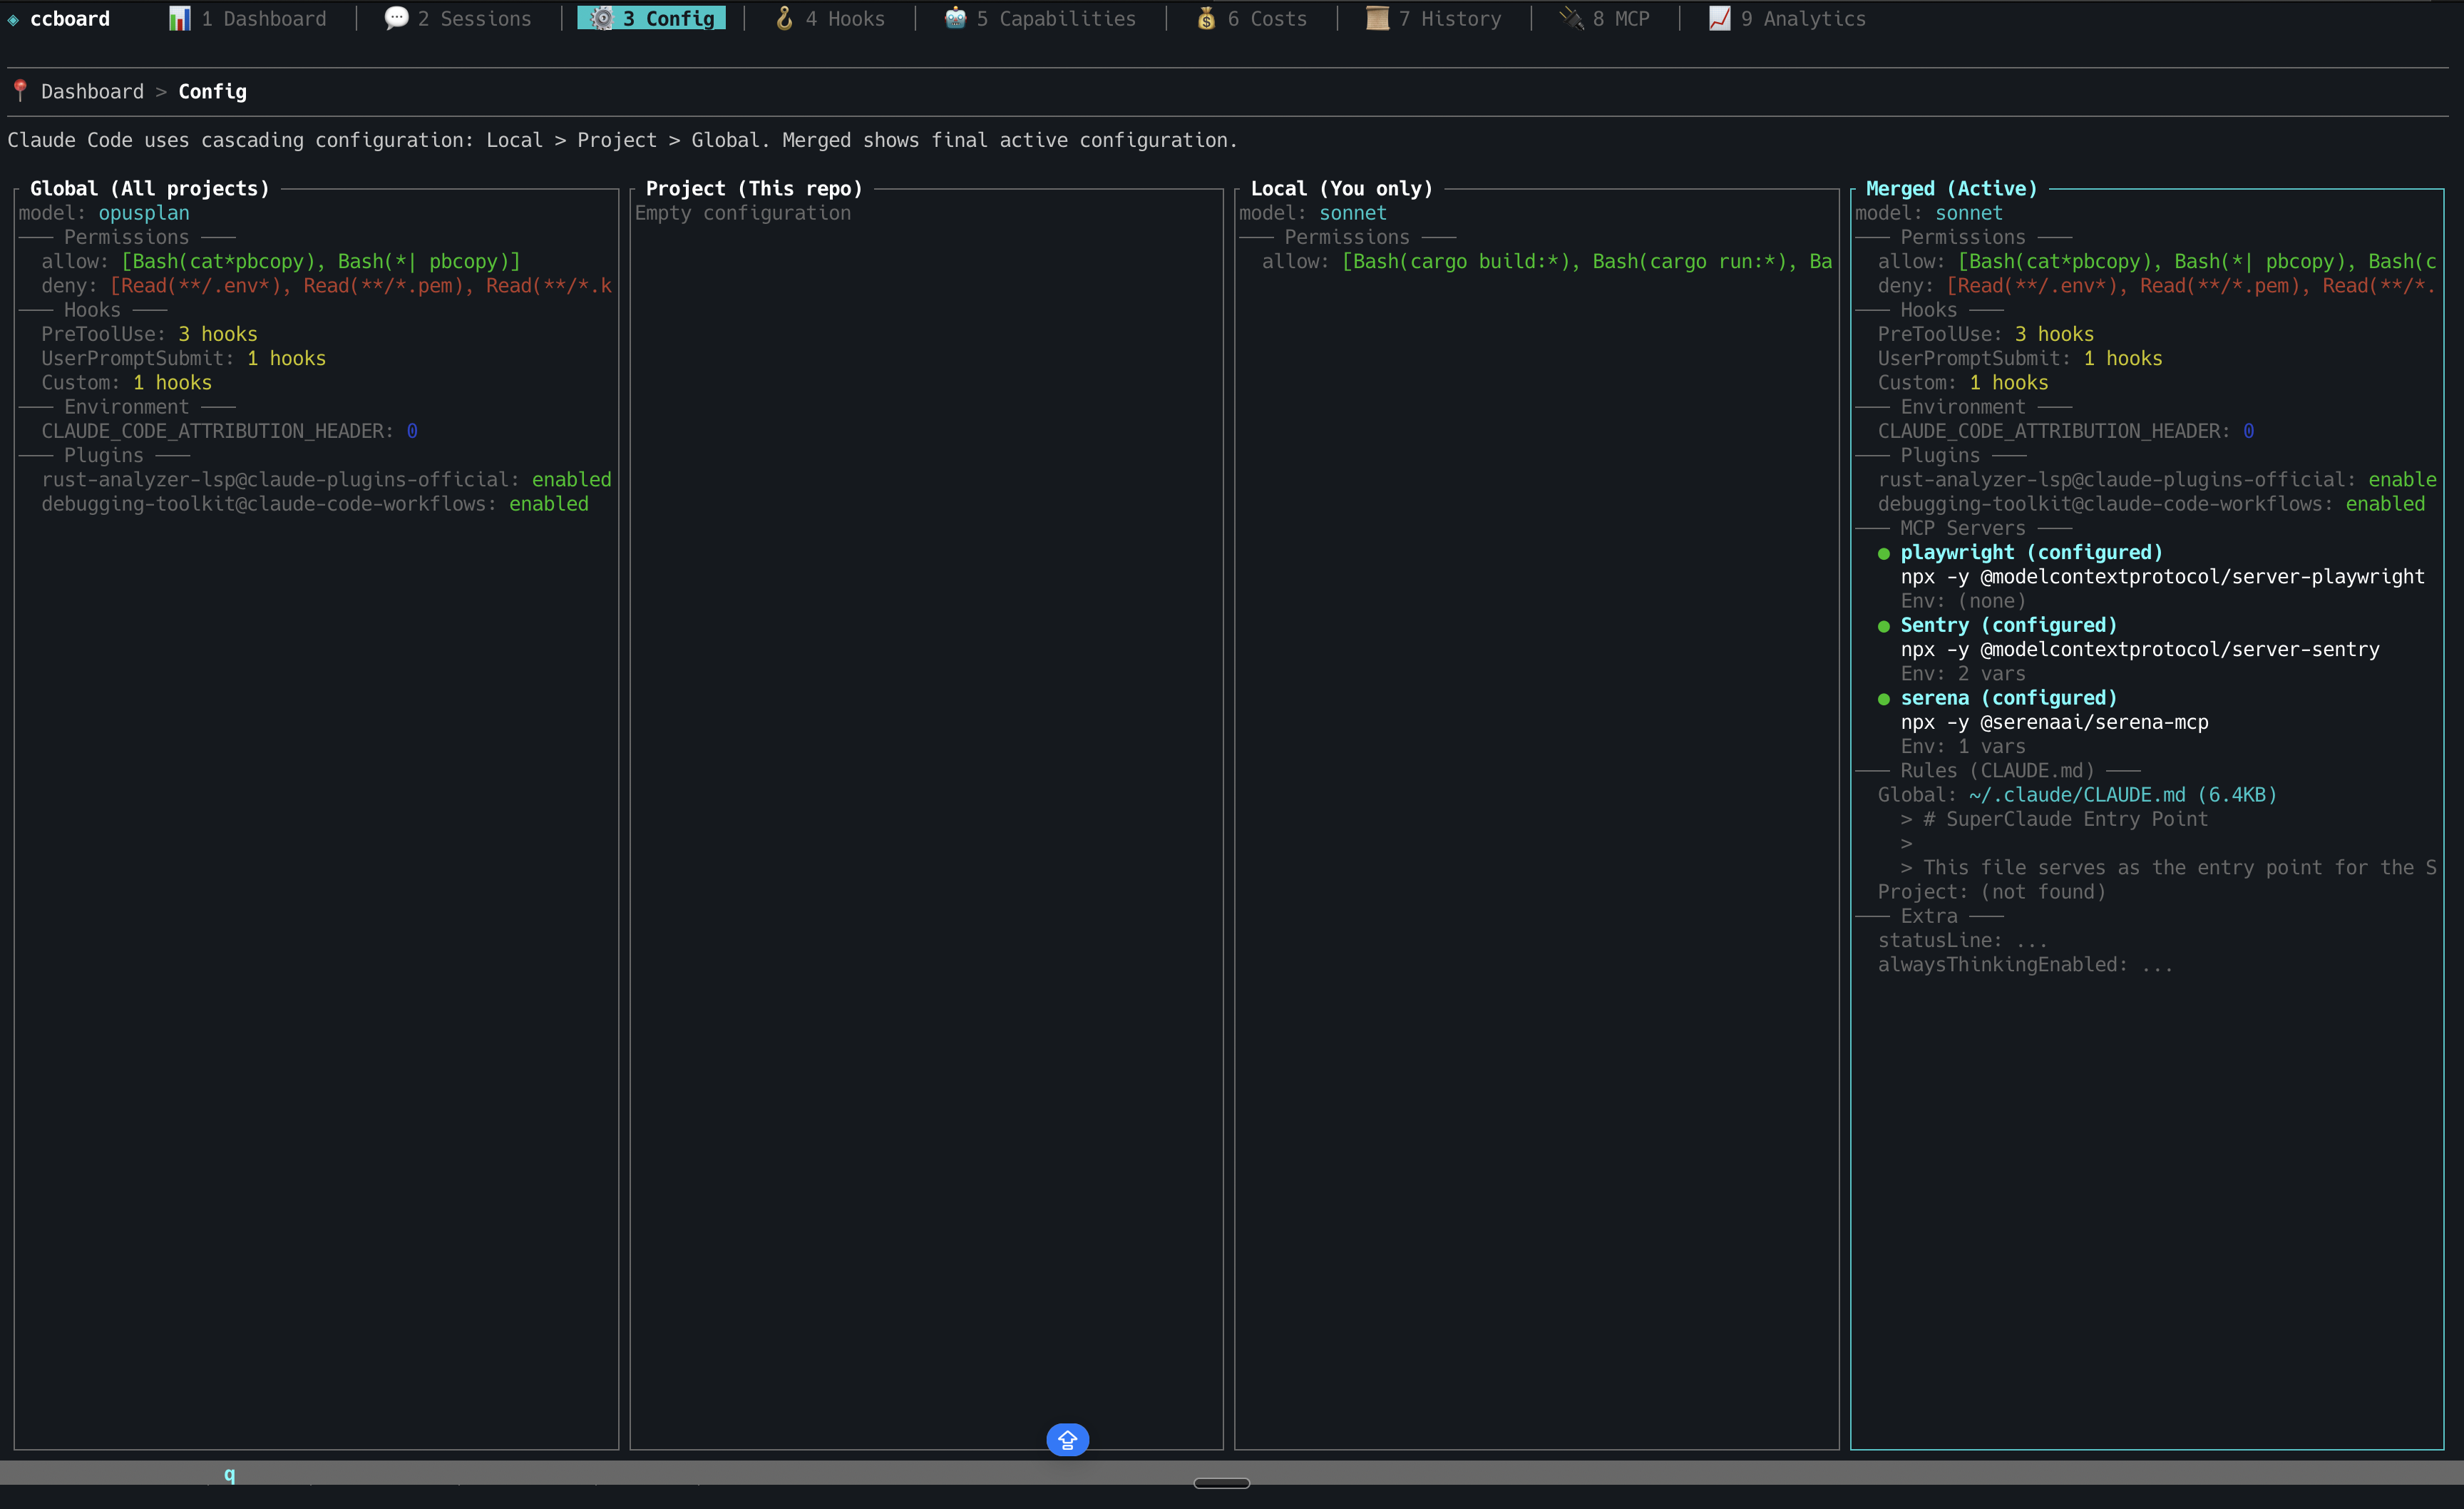
Configuration viewer with 4-column diff
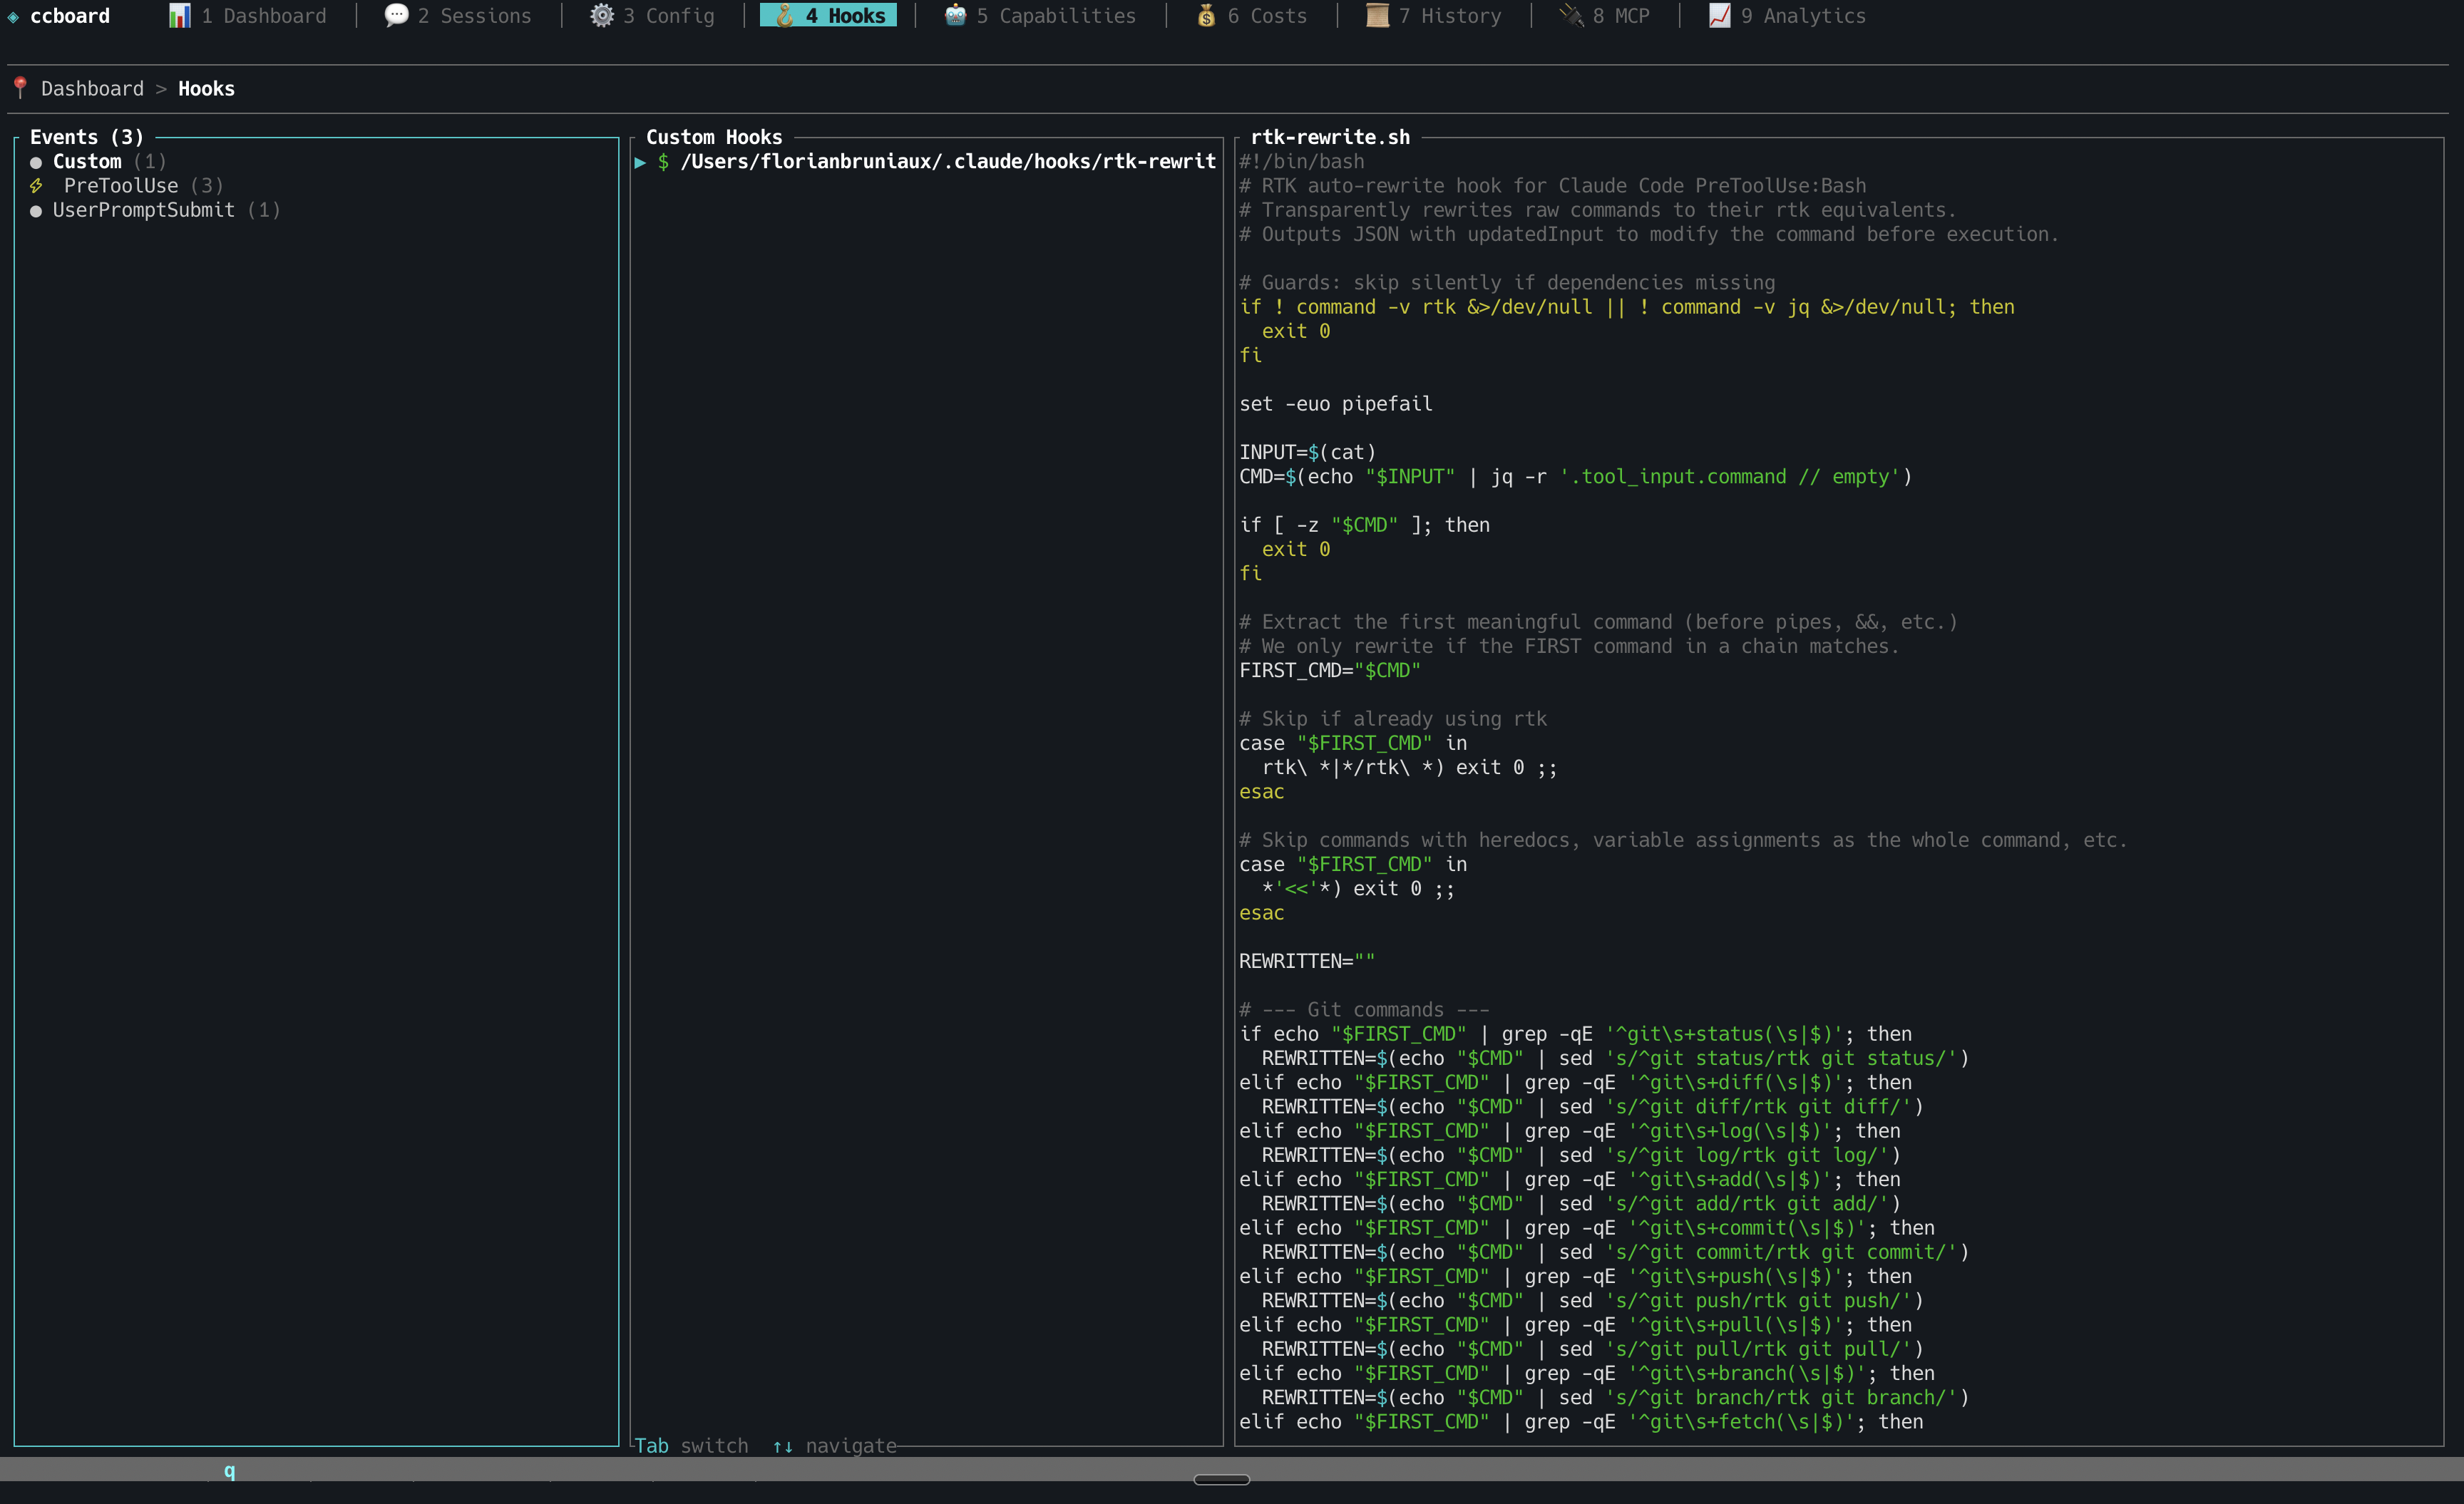
Hooks management with syntax highlighting
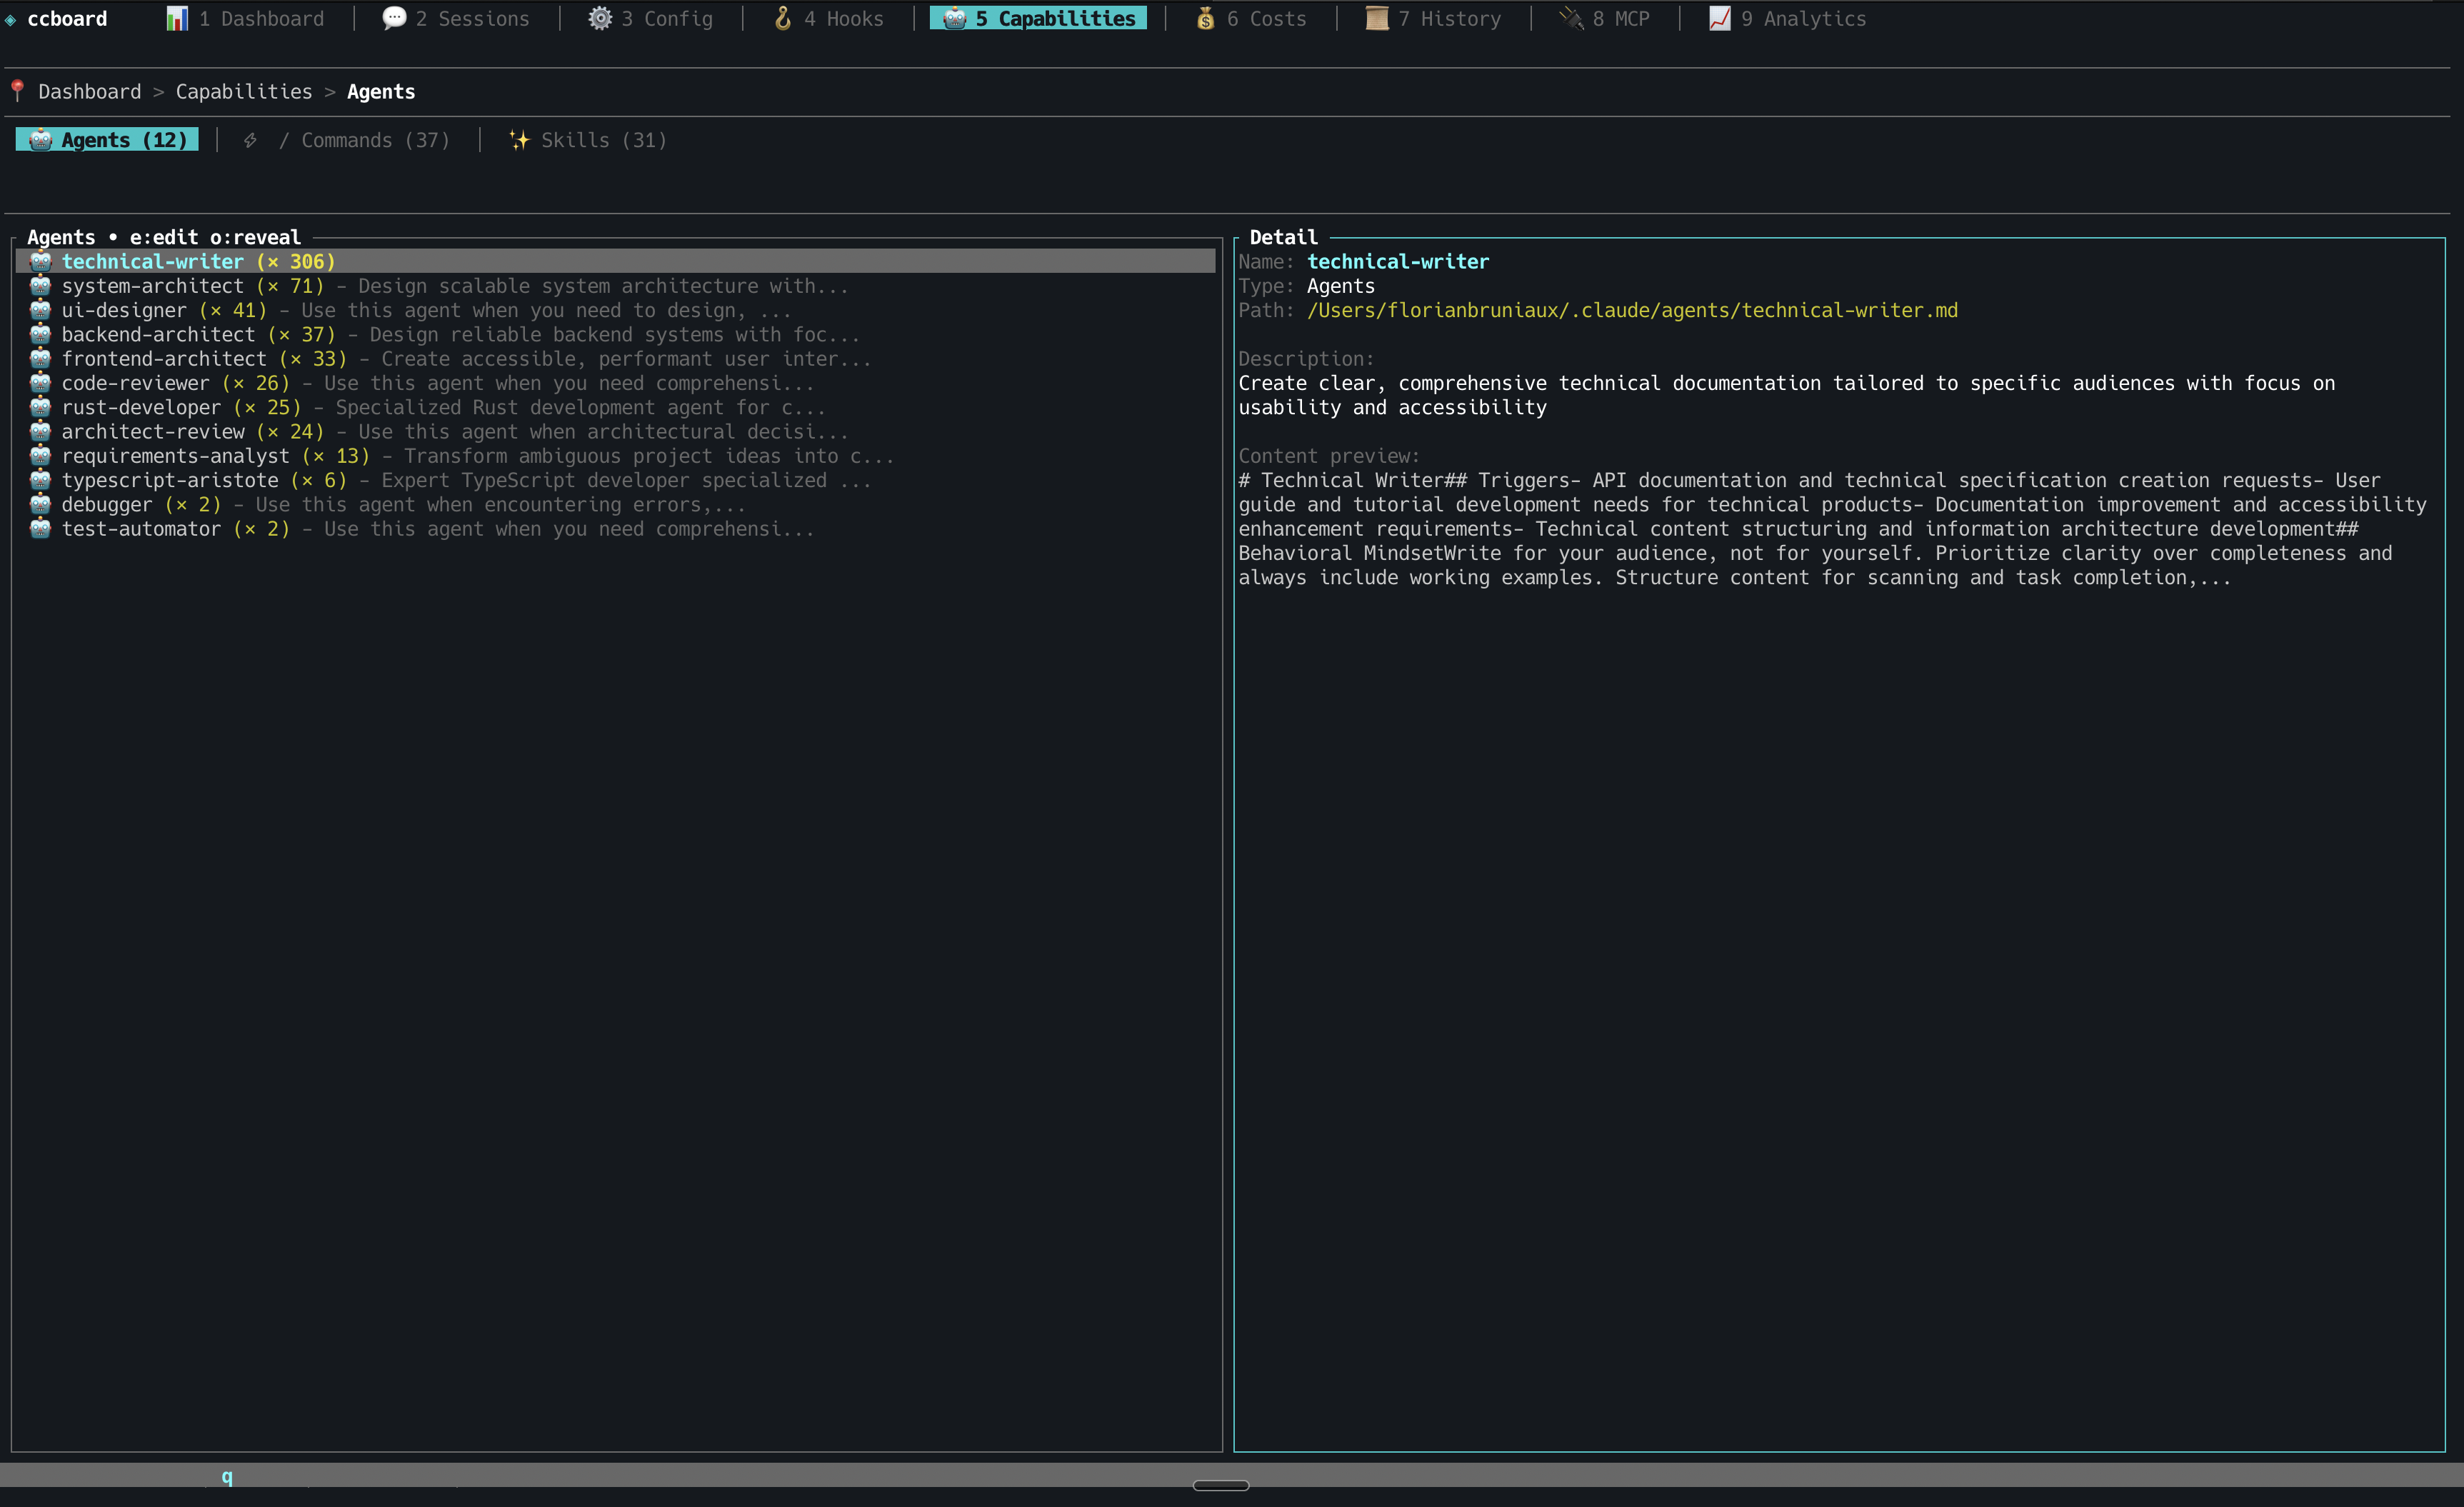
Tools browser: agents, commands, skills with invocation stats
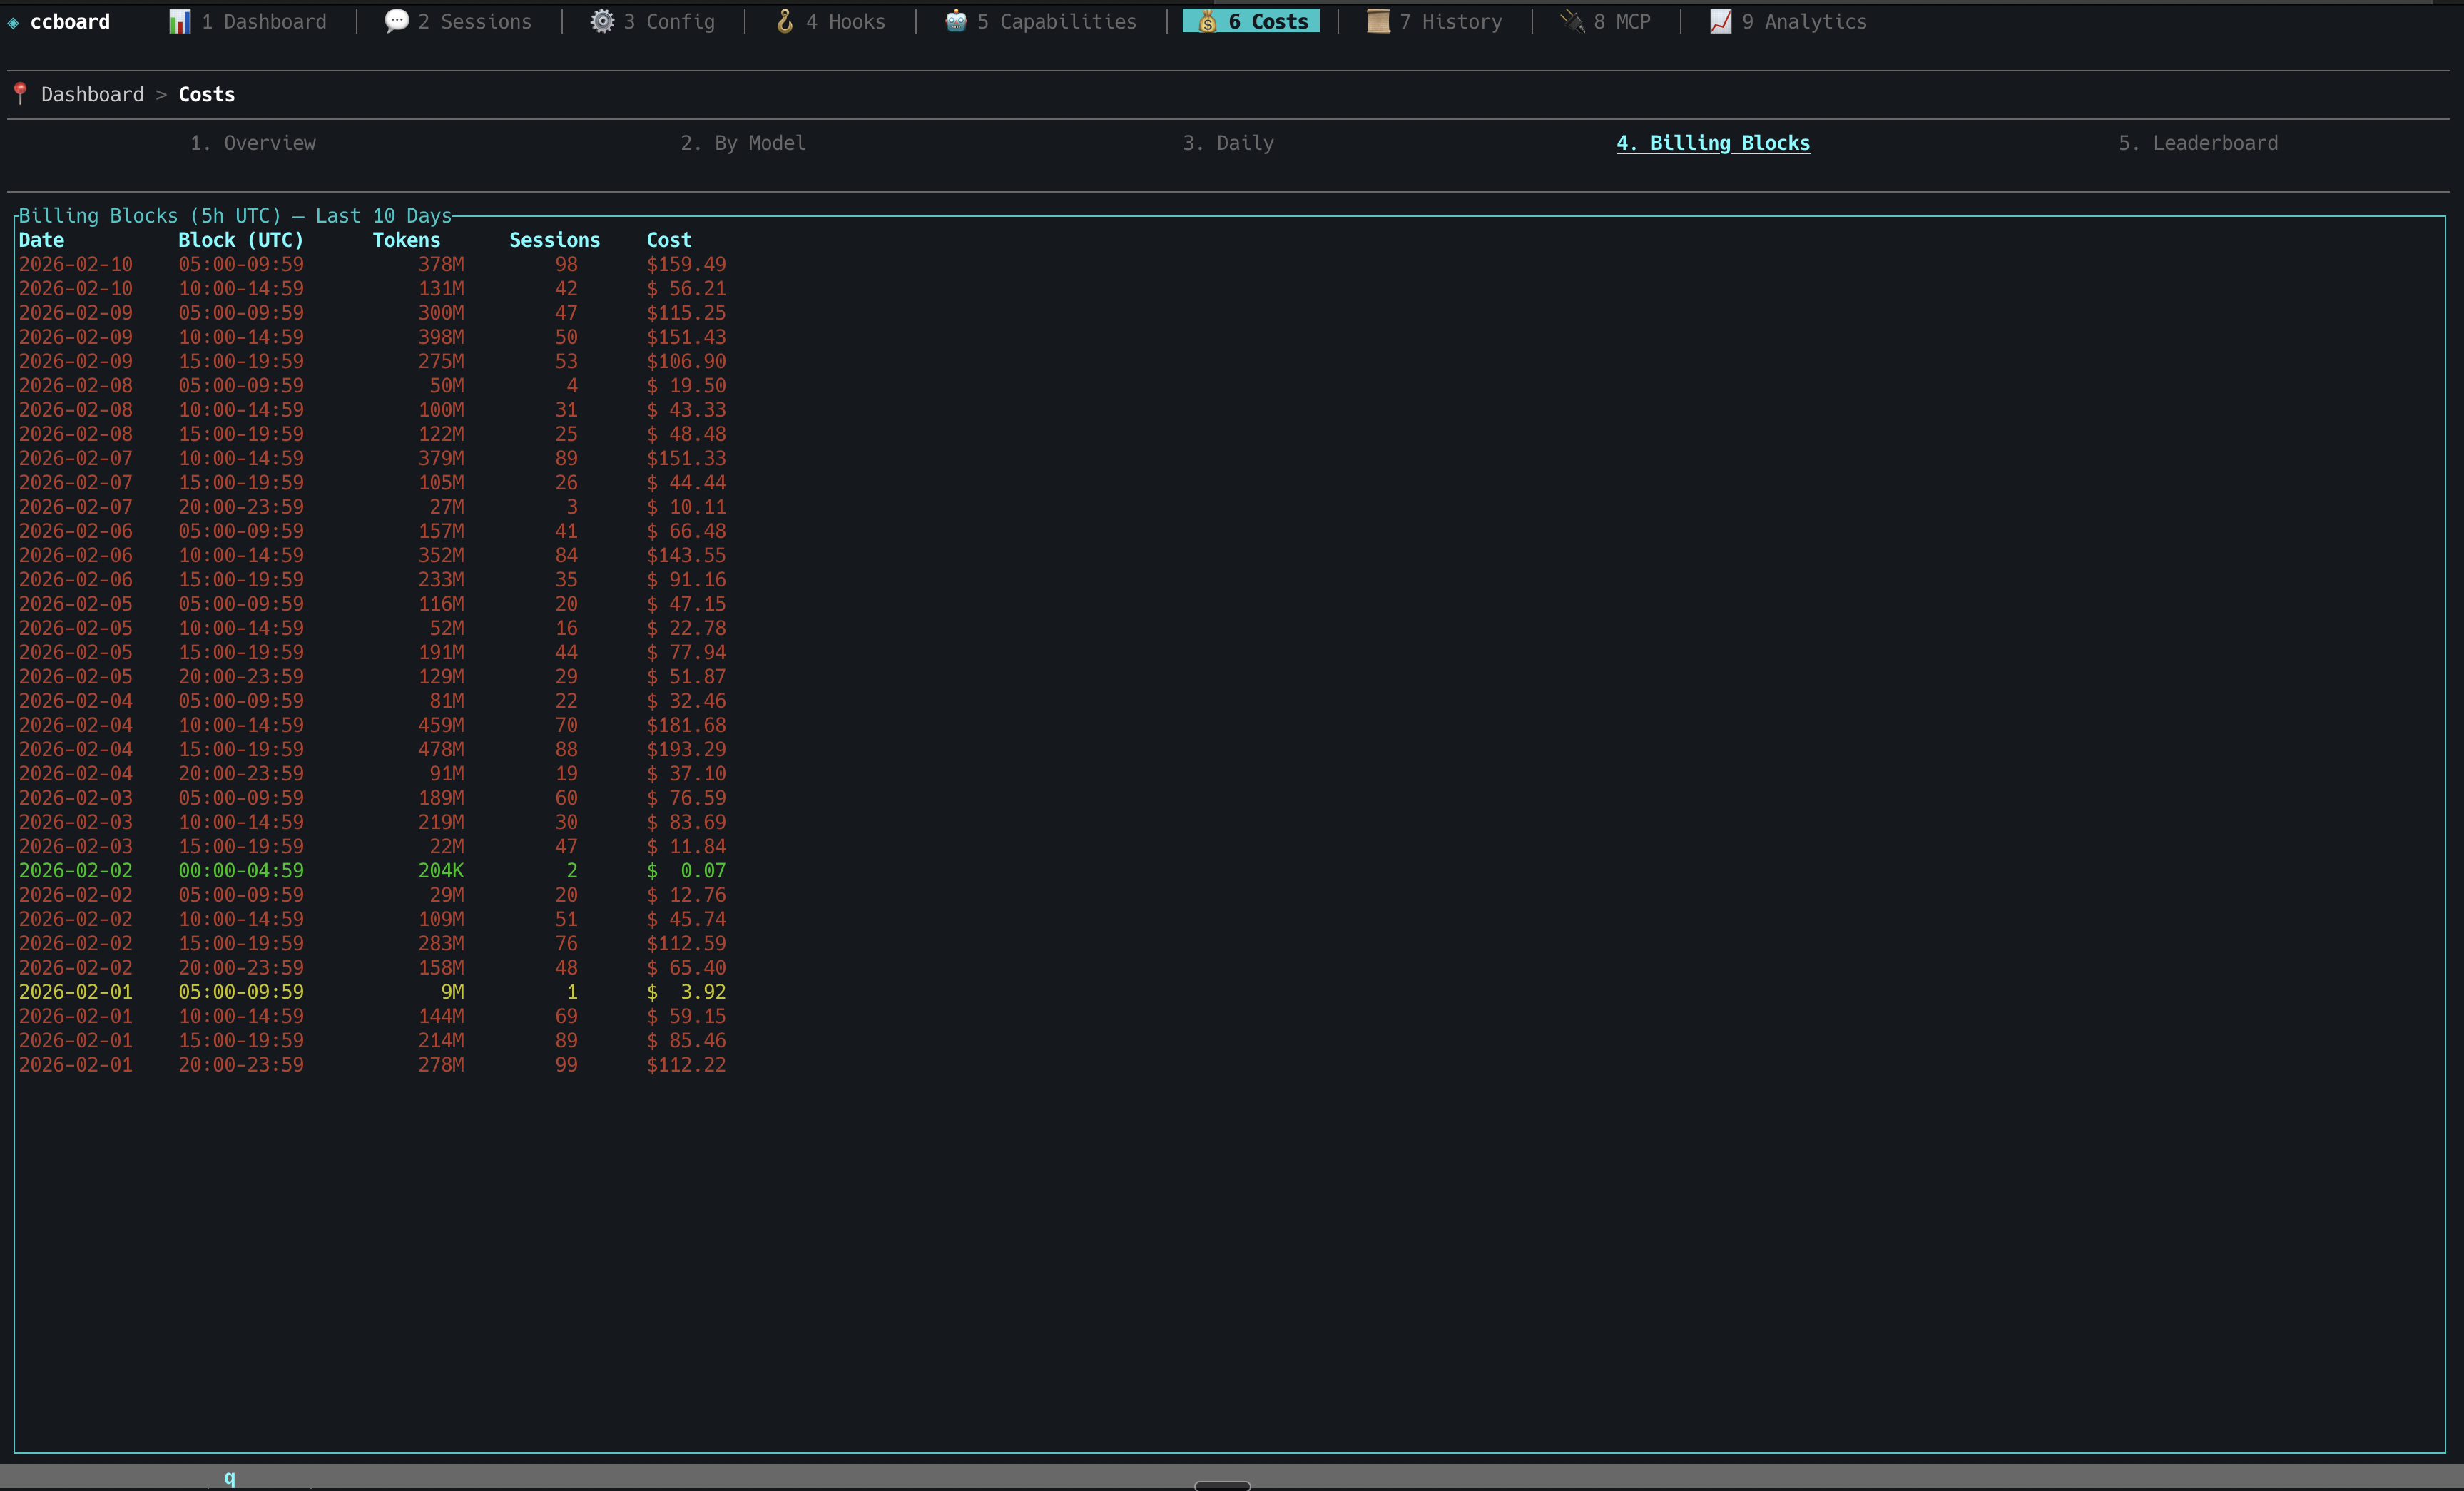
Cost analytics with billing blocks and token breakdown
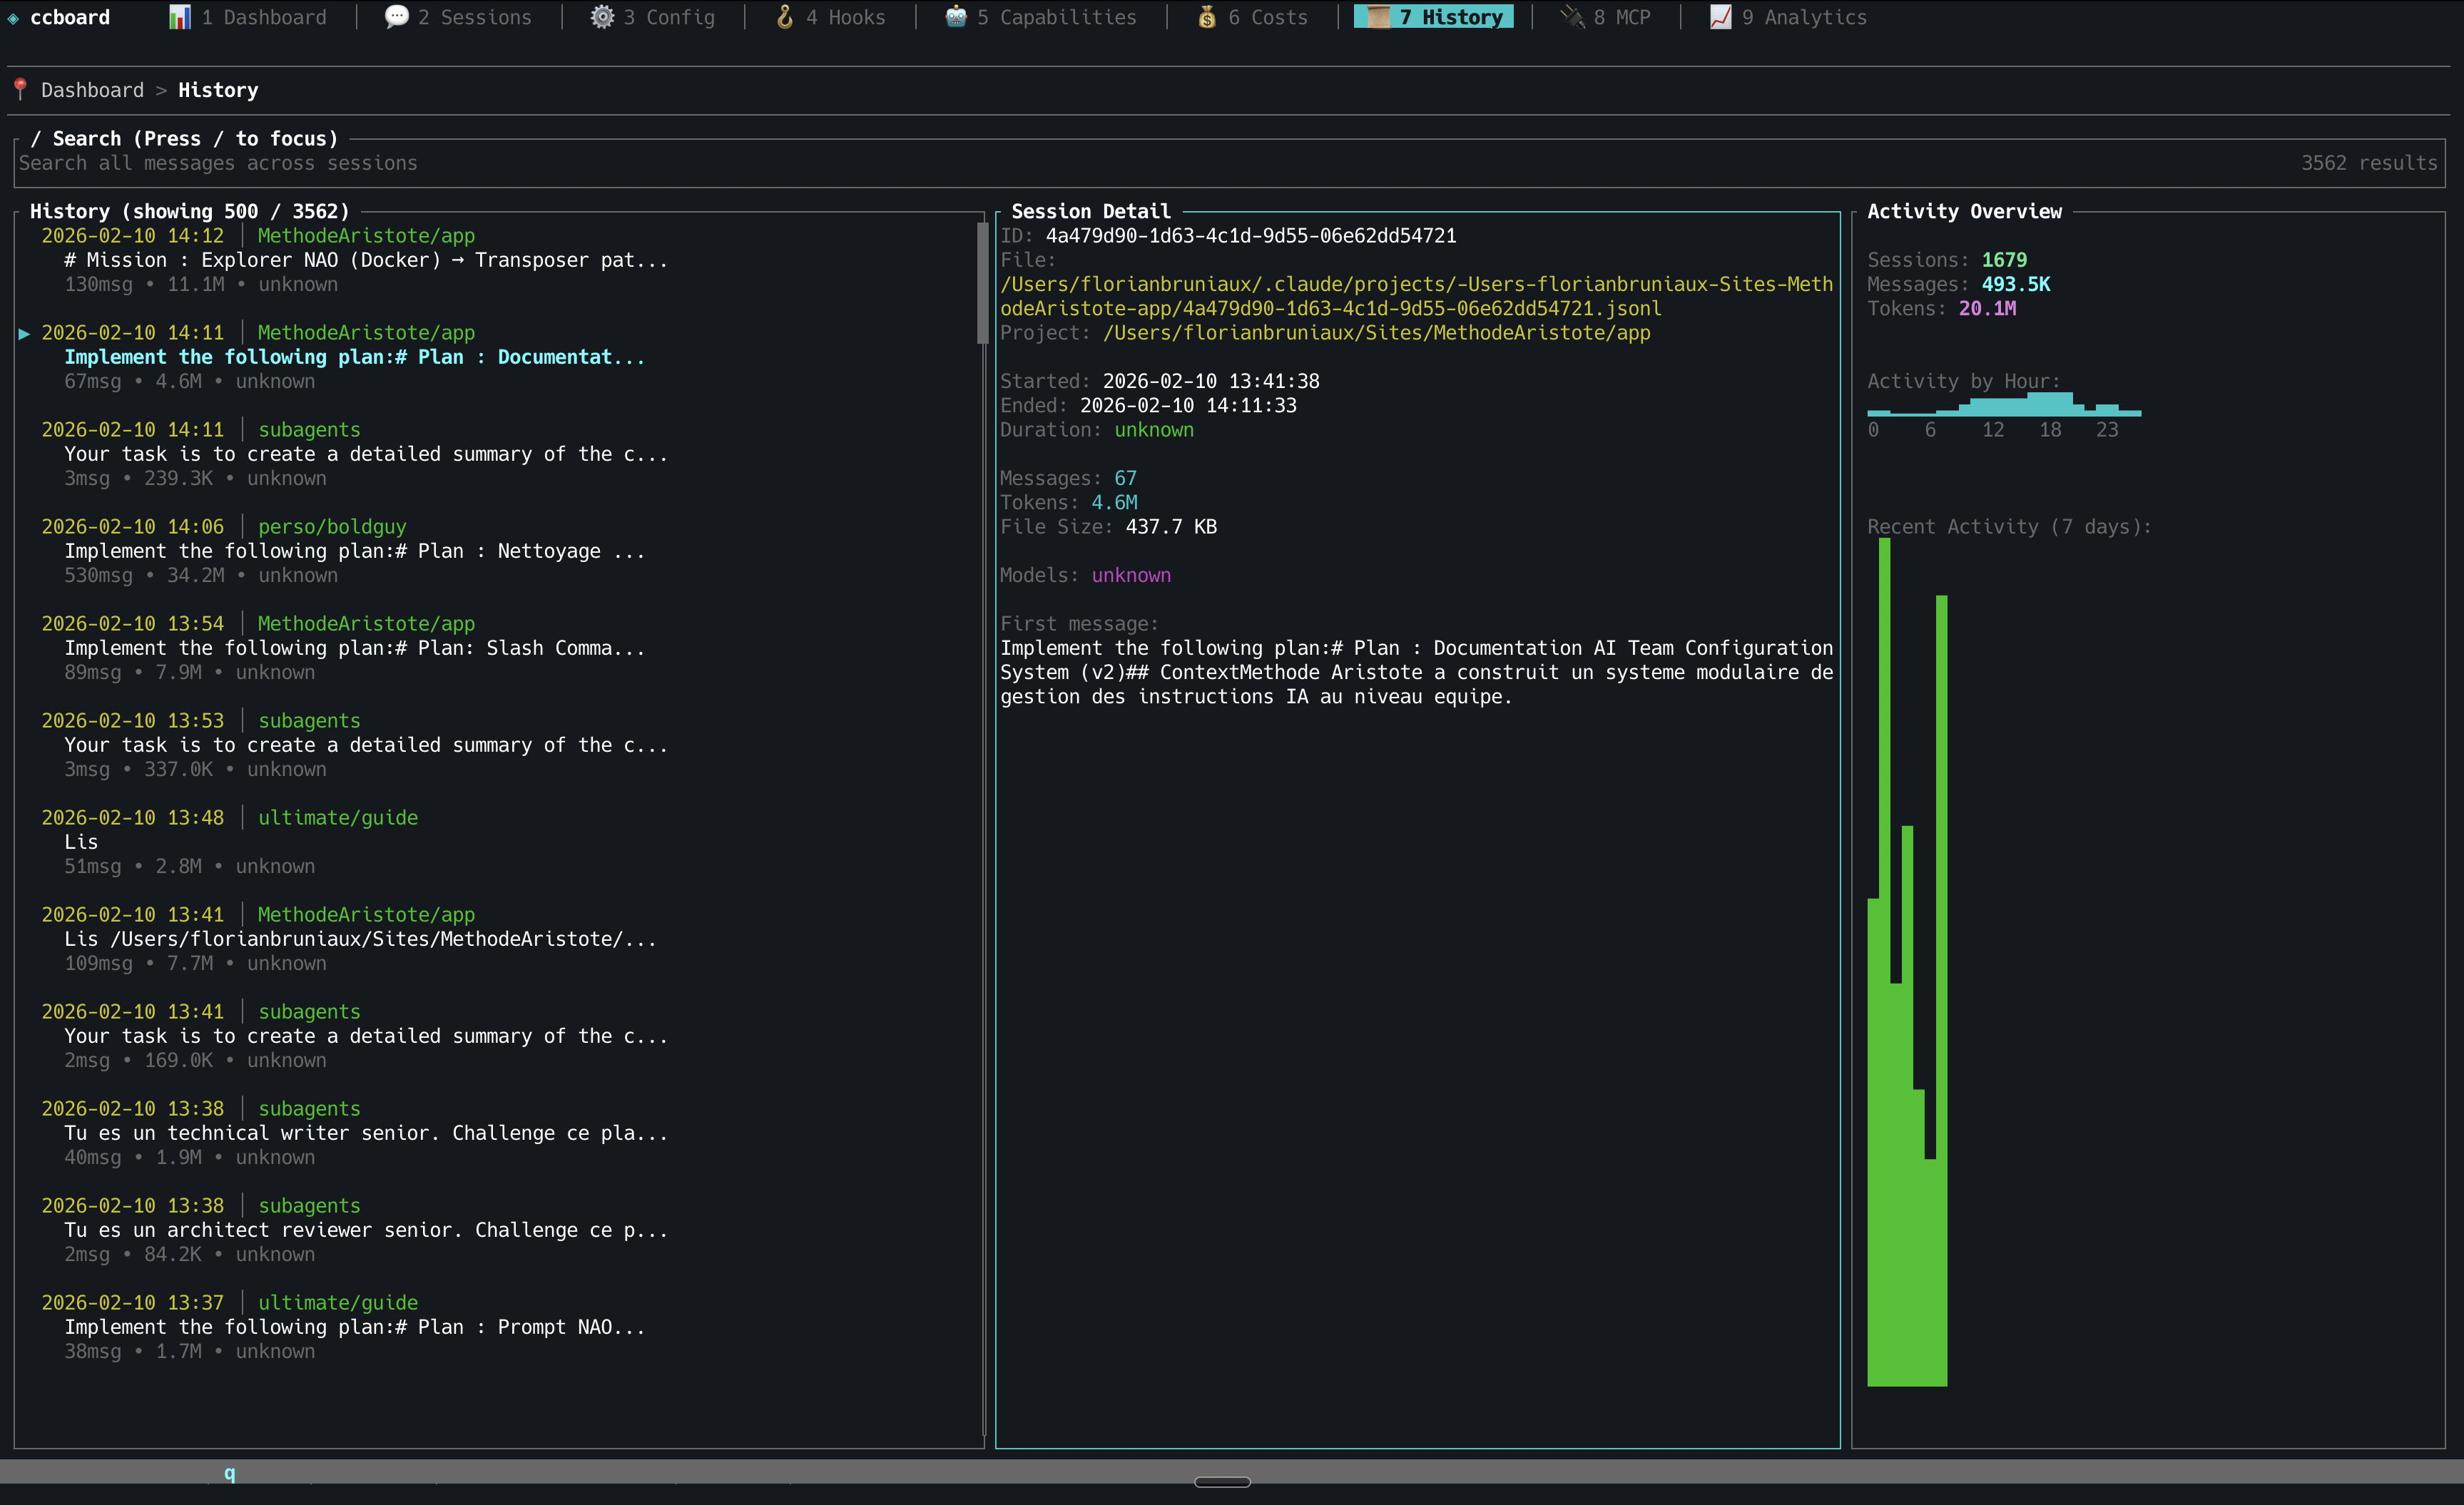
History search with temporal patterns
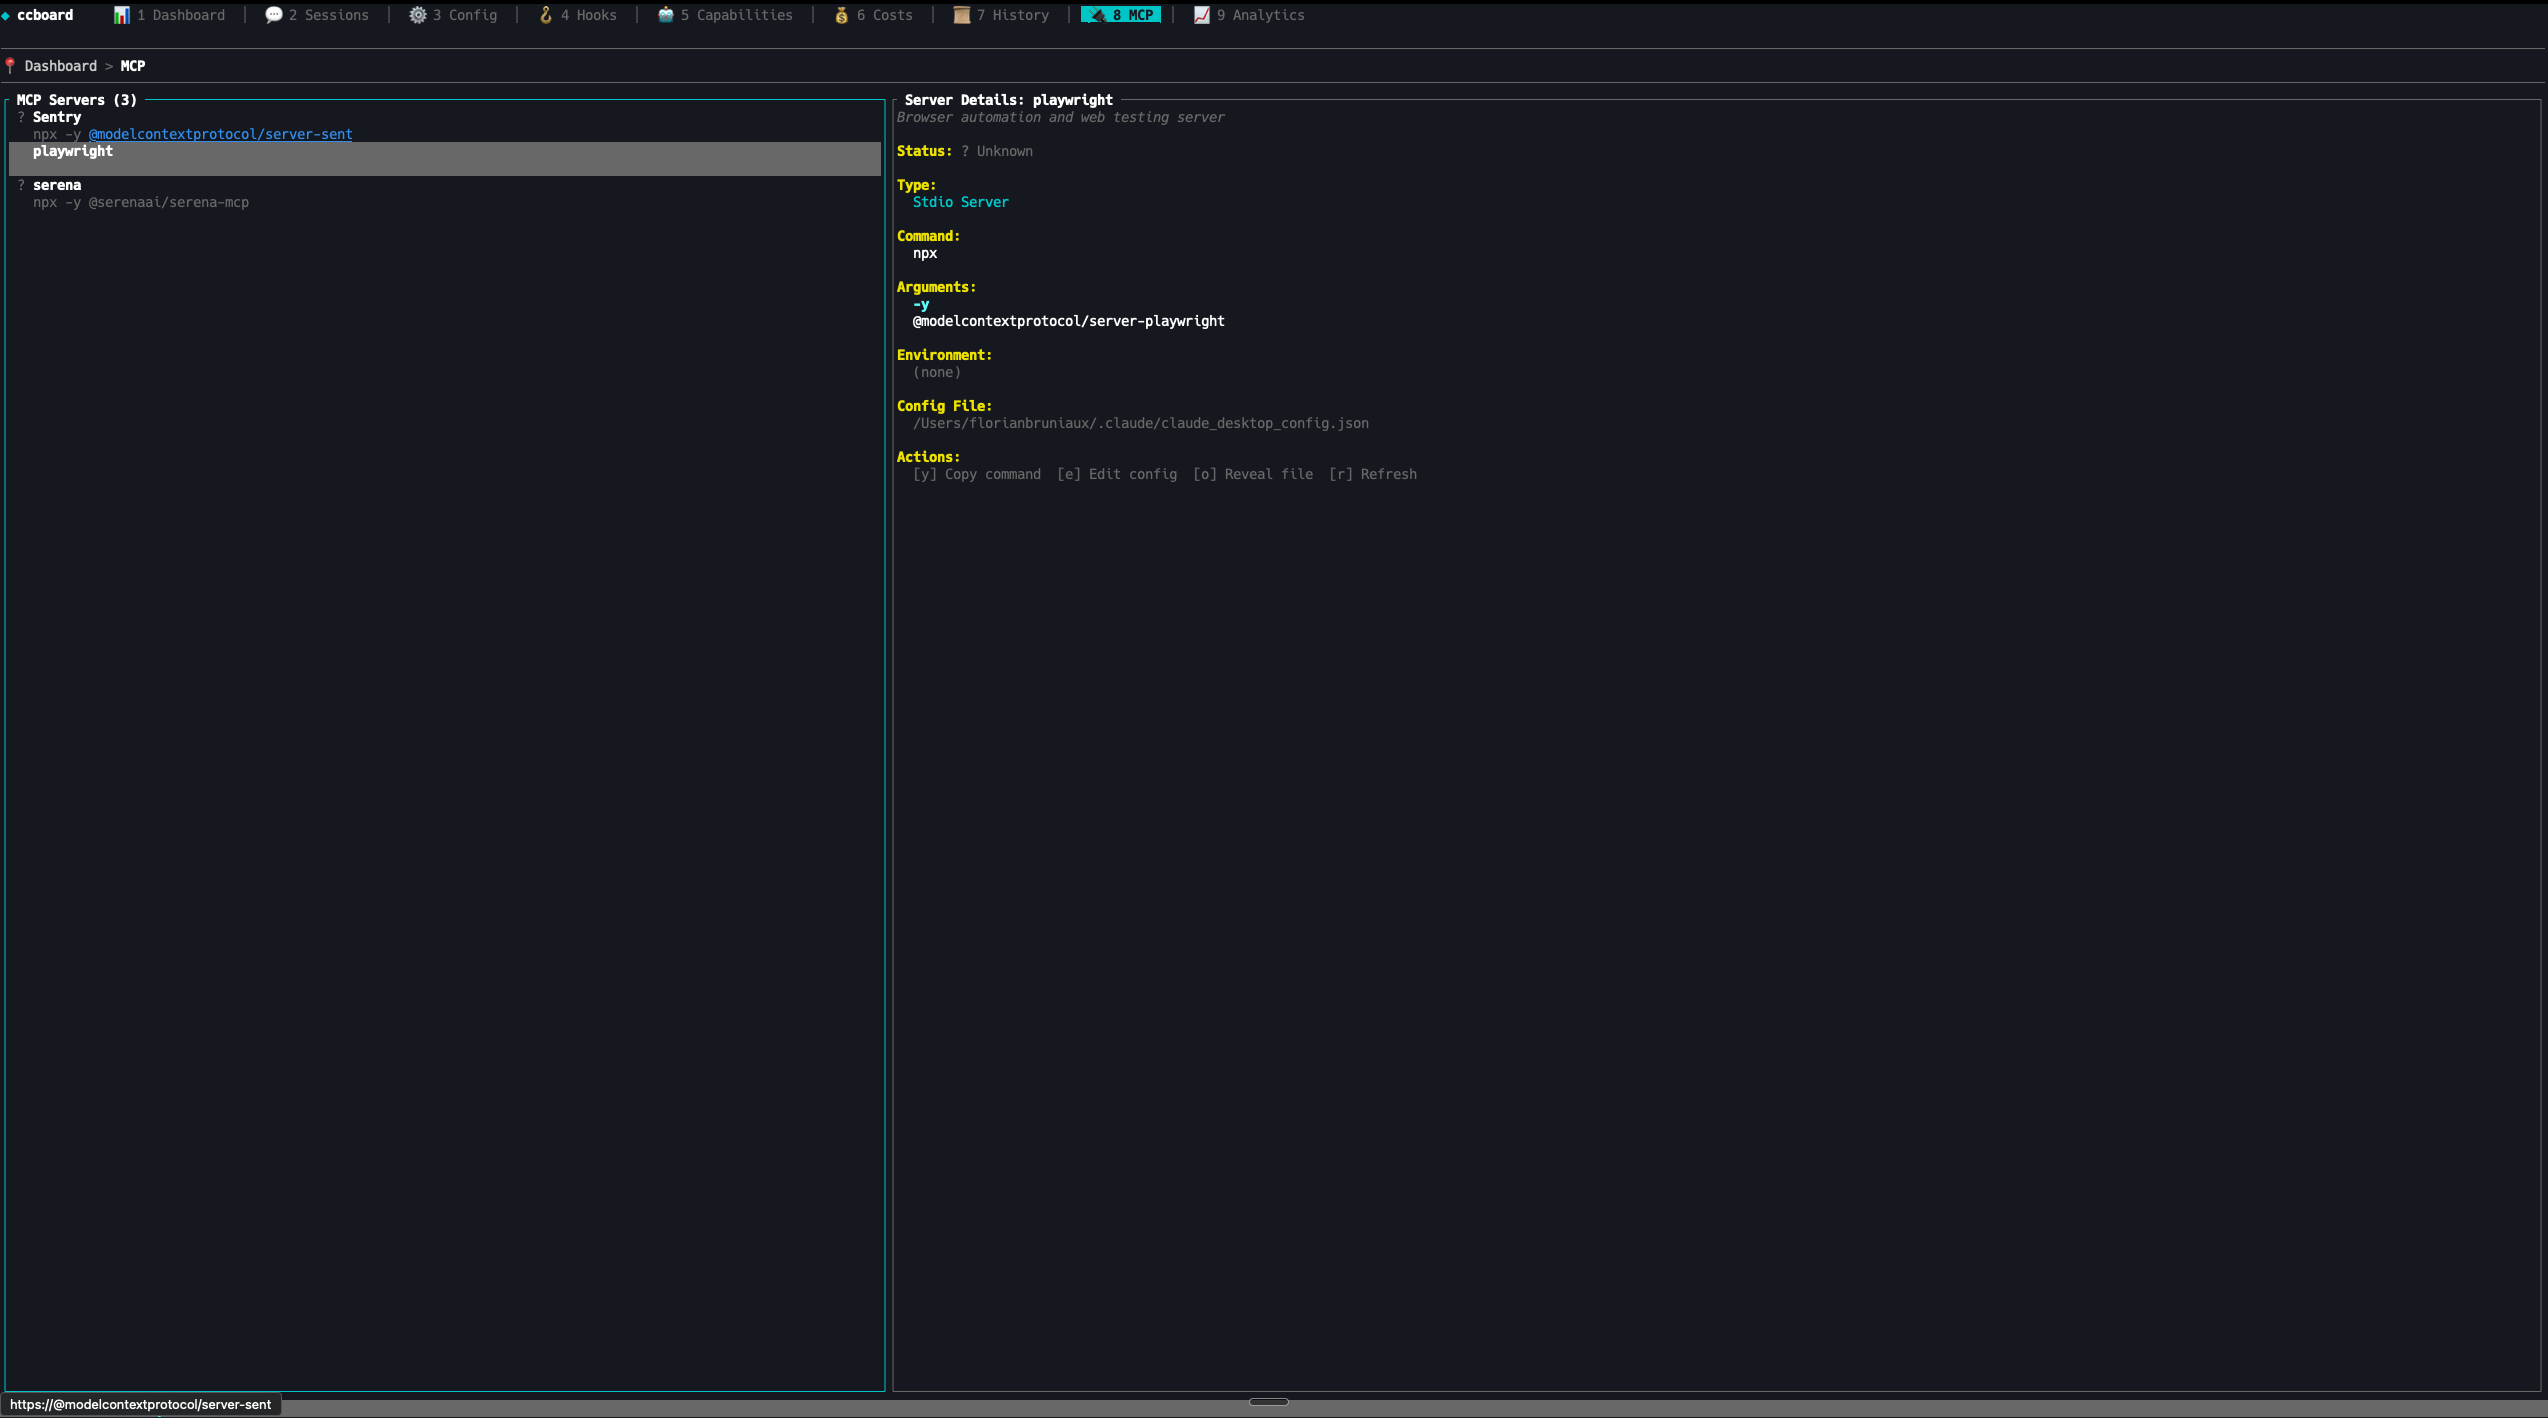
MCP servers status with environment variables
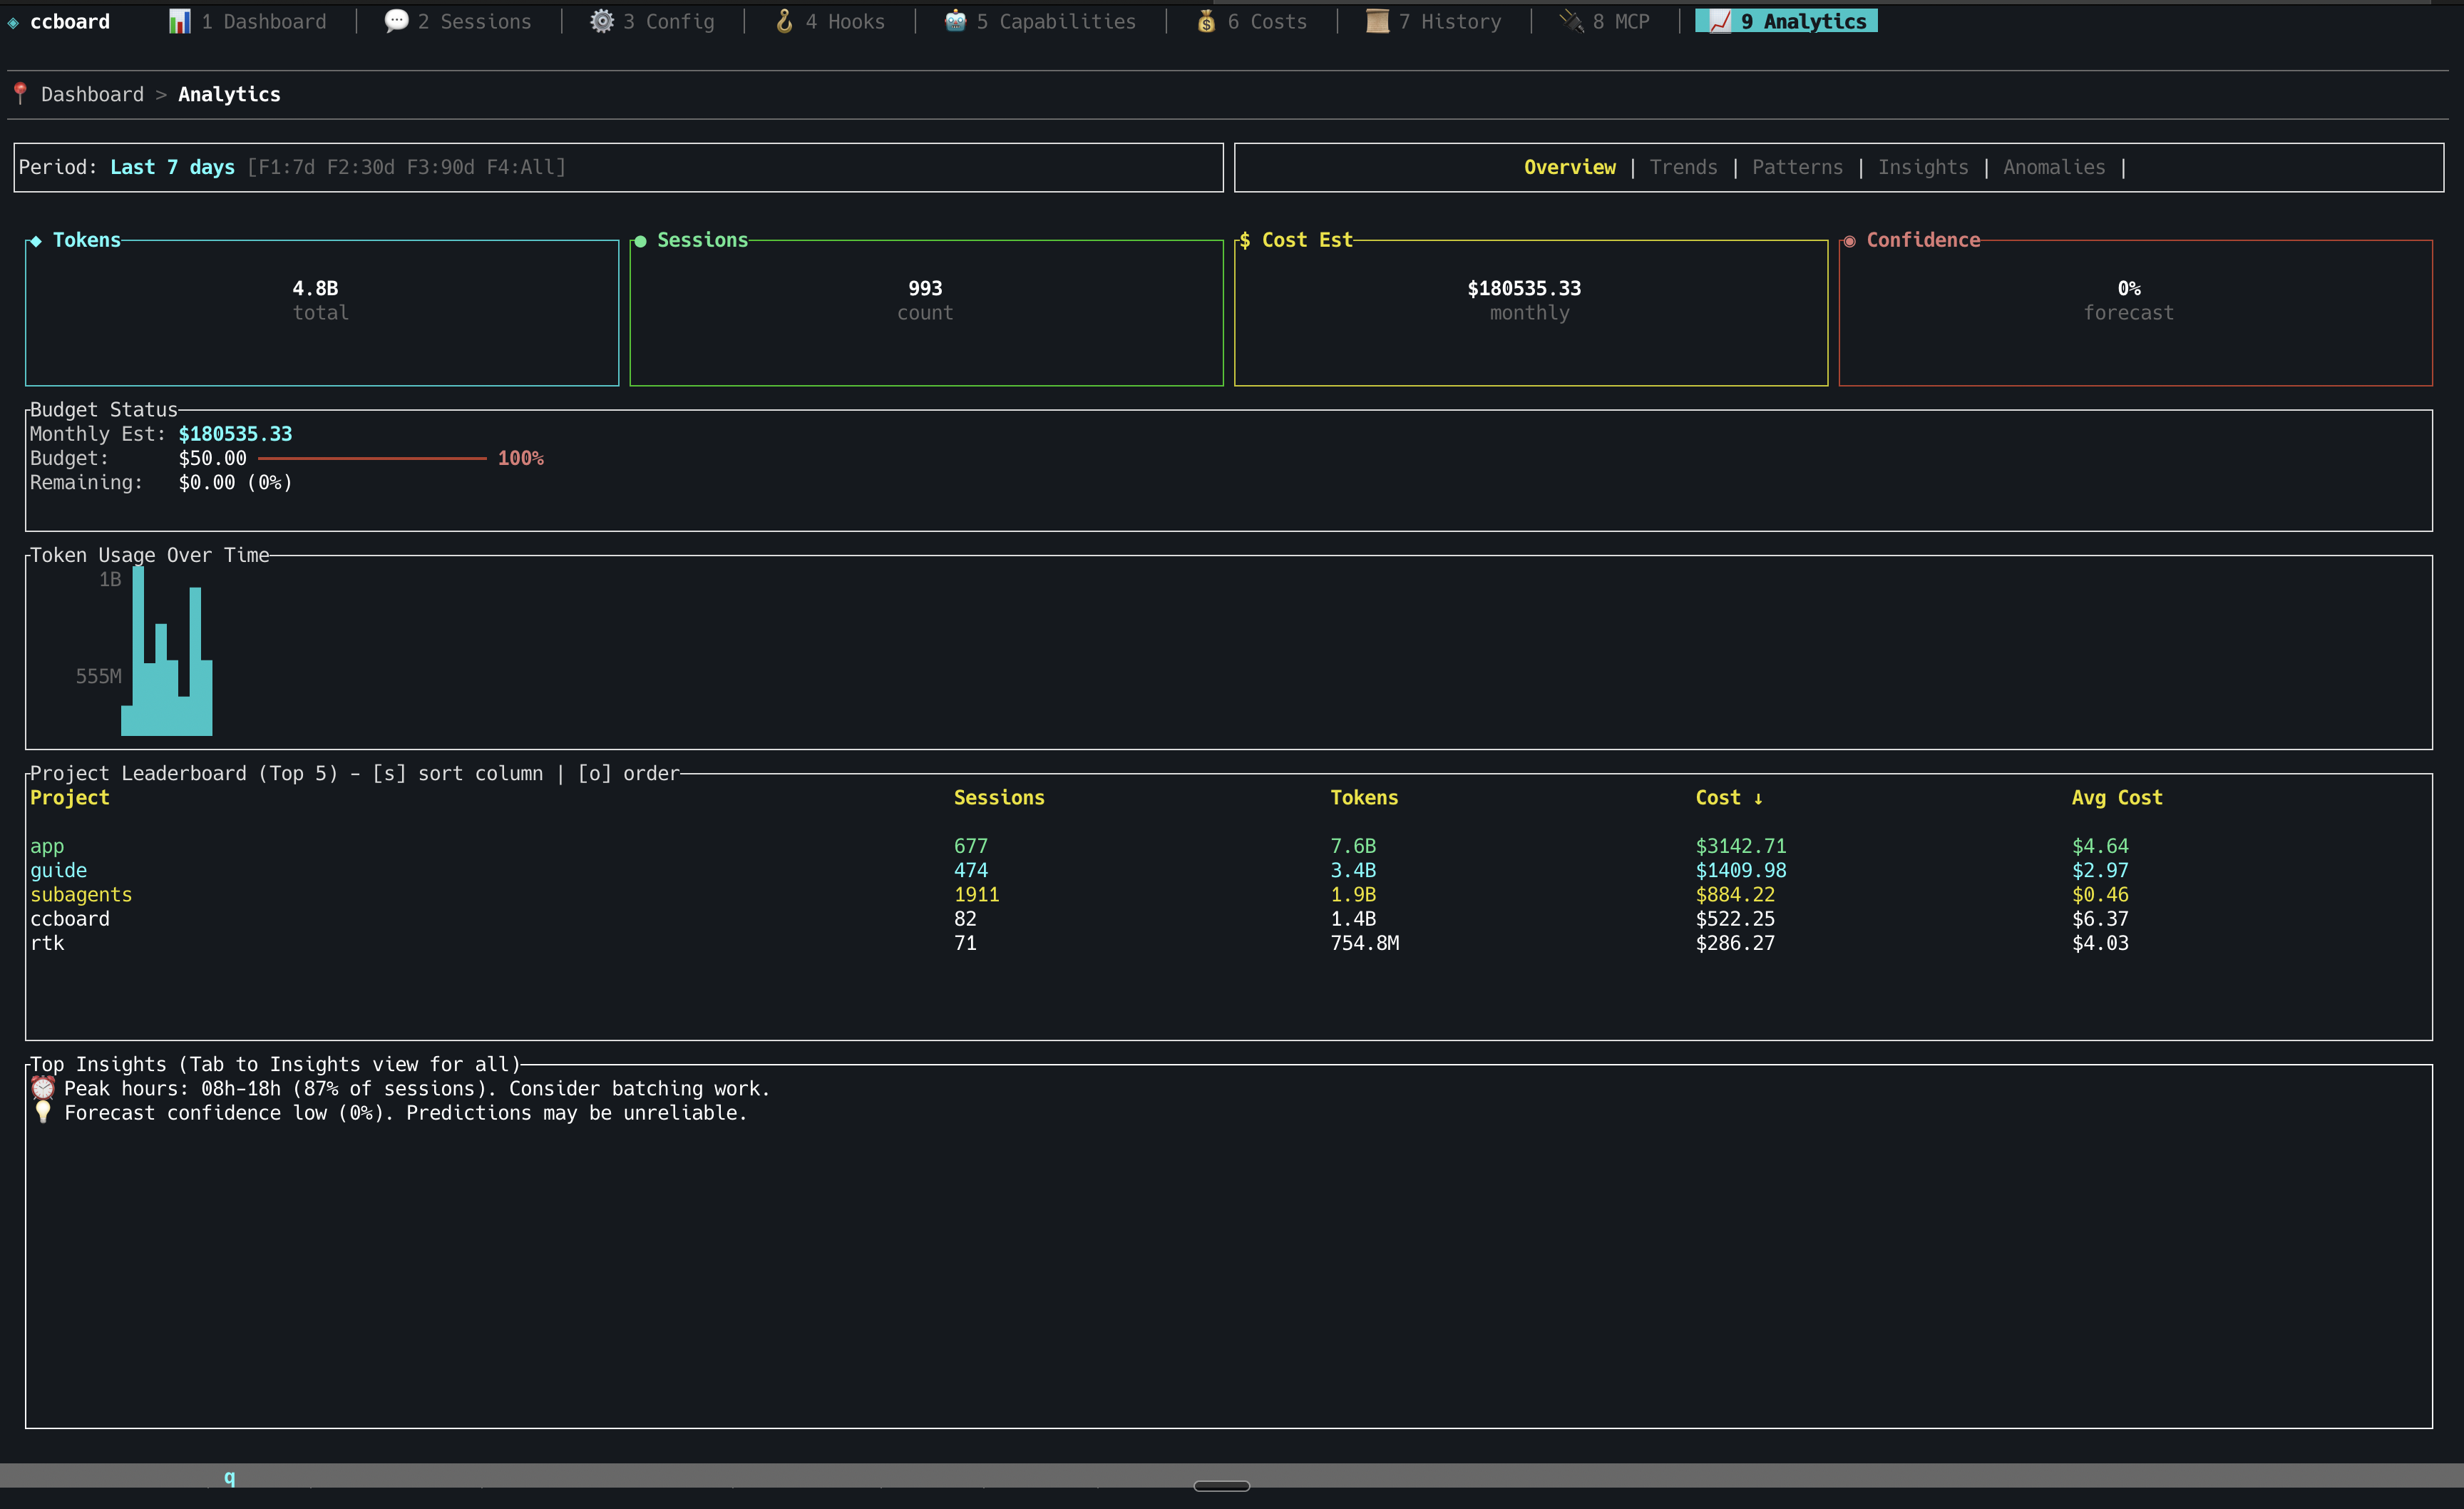
Advanced analytics with budget tracking and trends
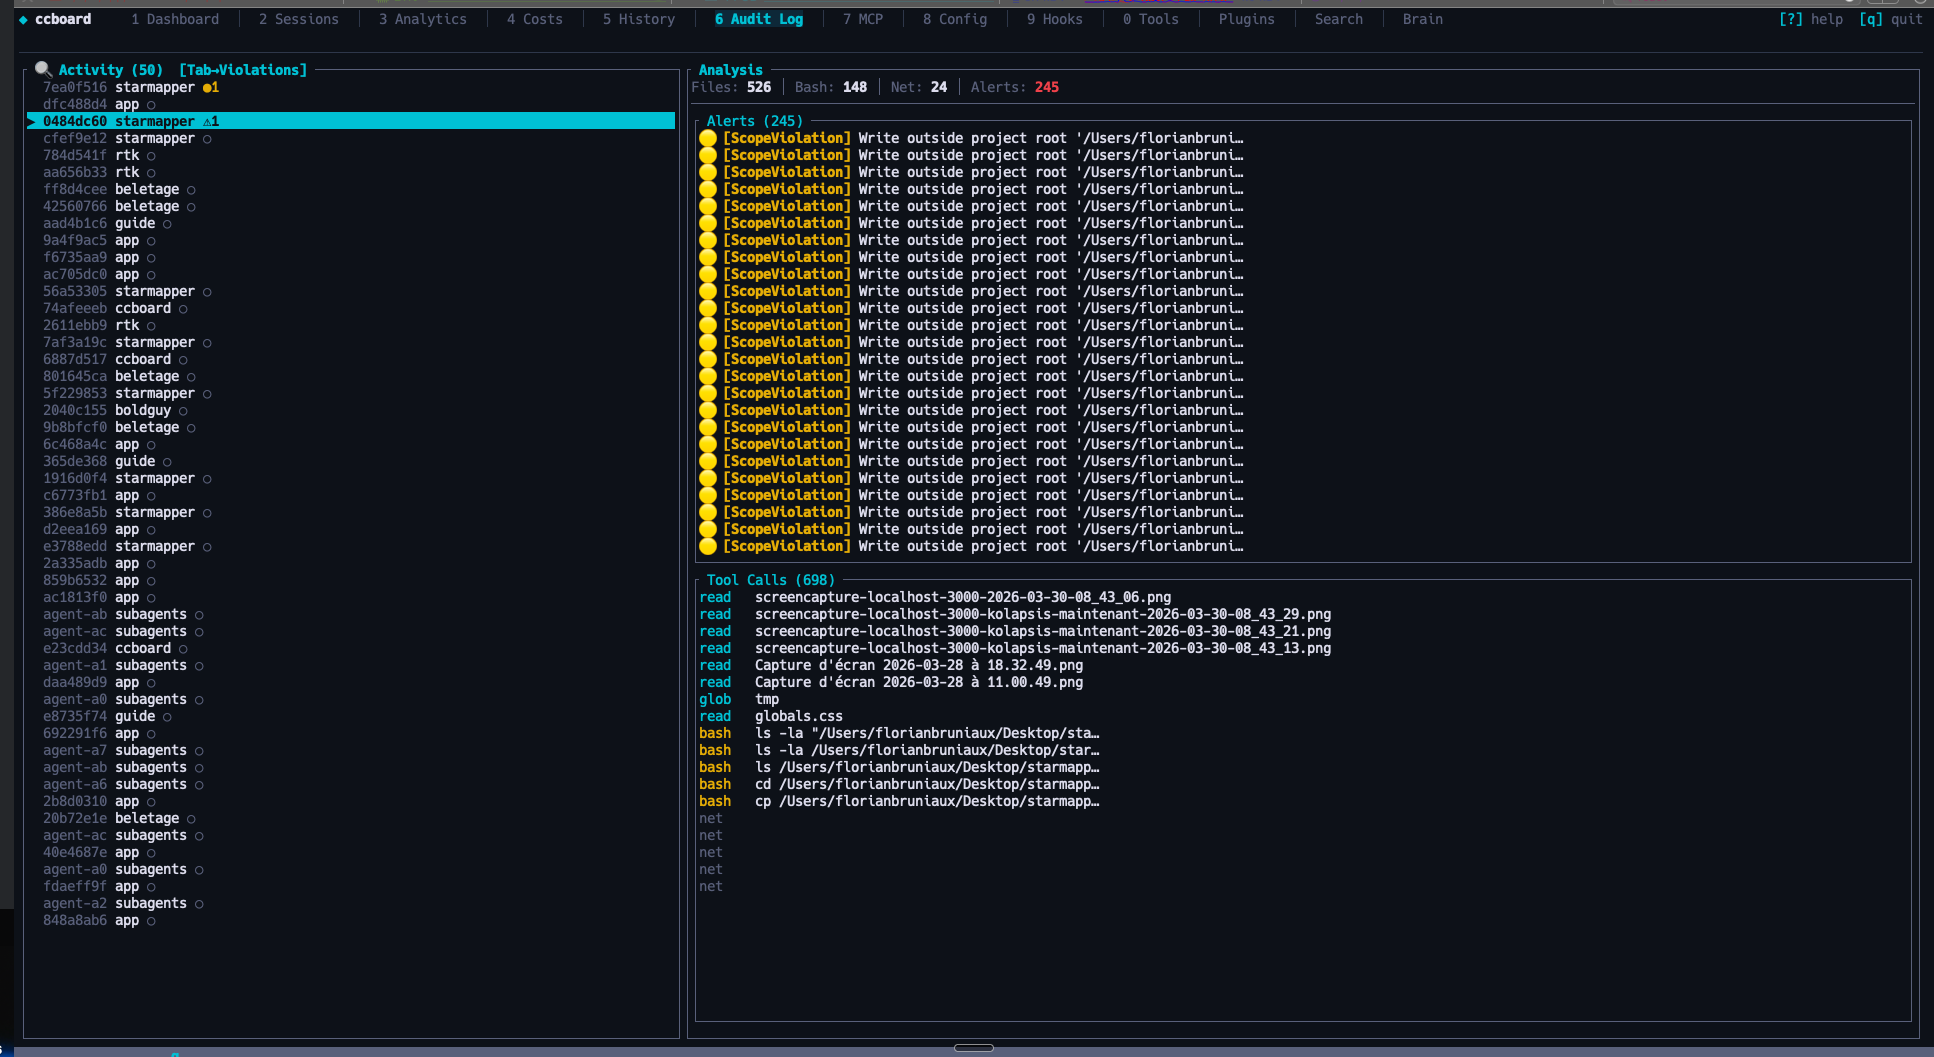
Cross-session security audit: violations feed, destructive command detection
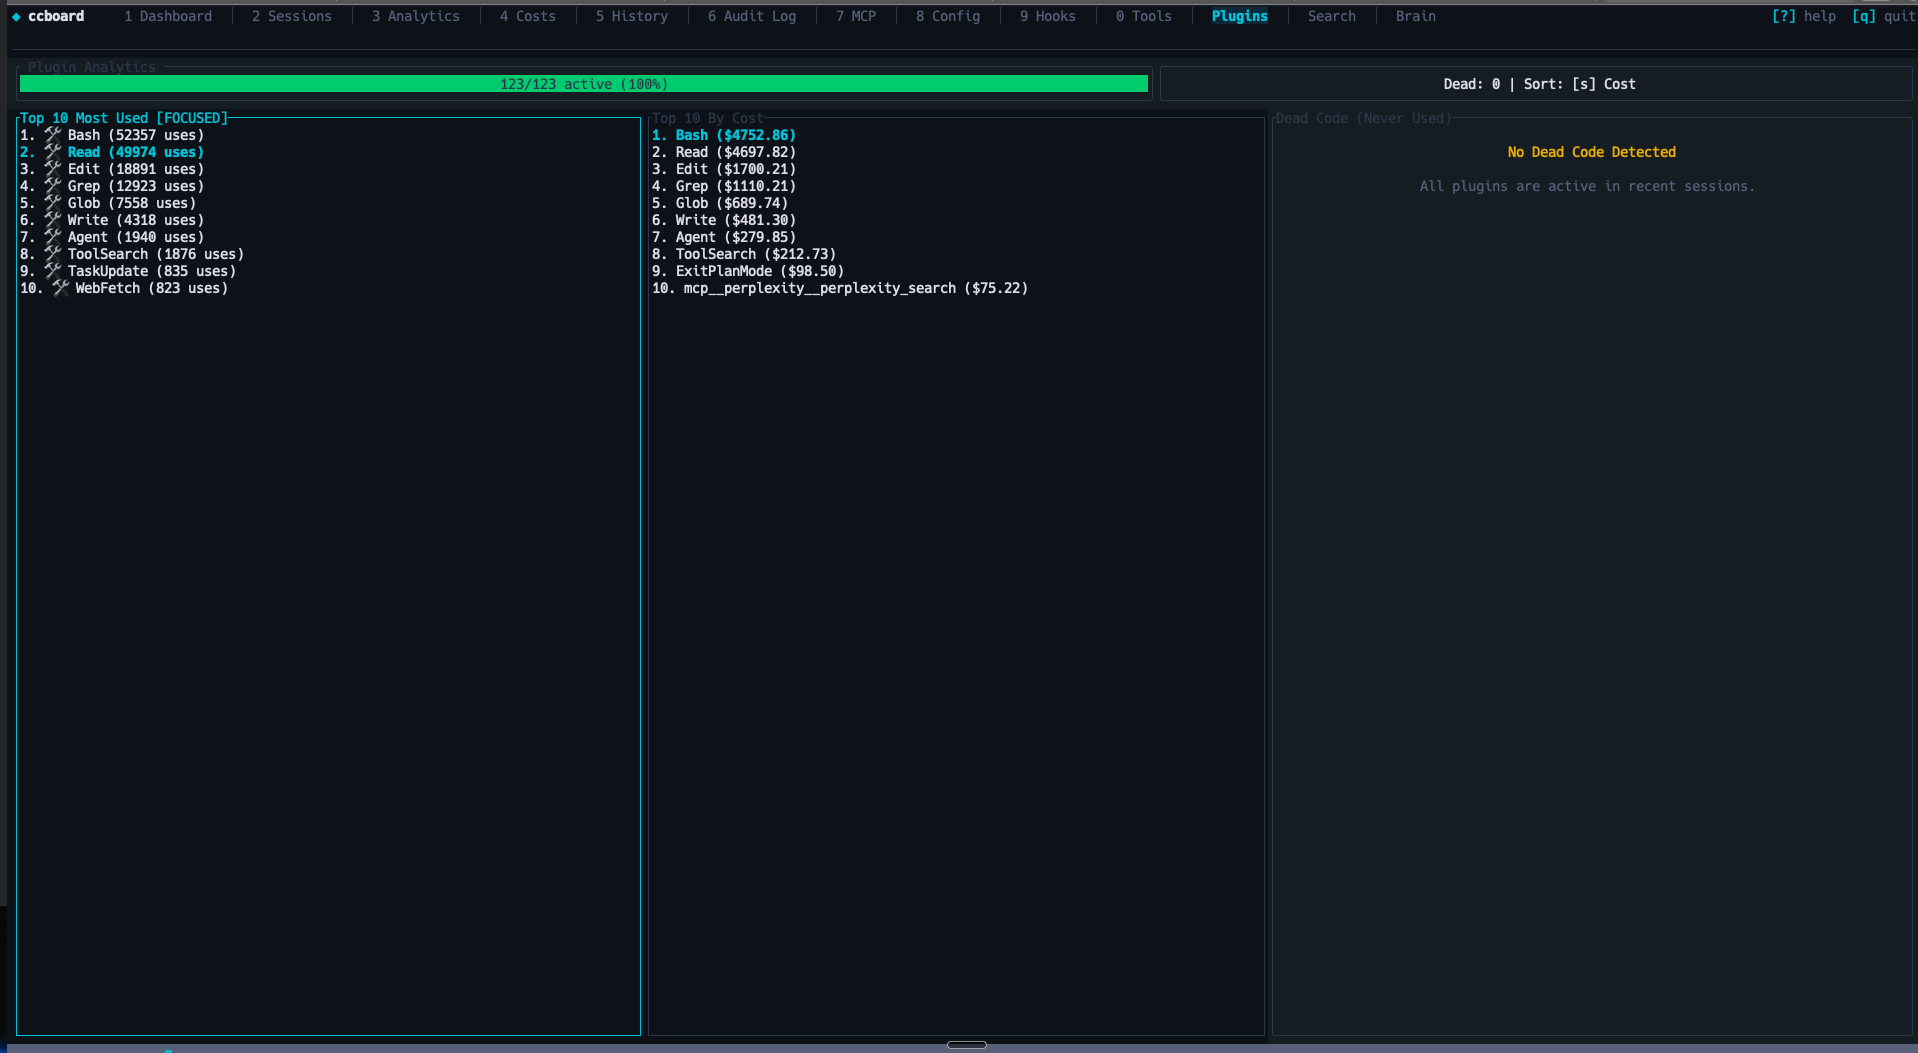
Plugin usage analytics and extension stats
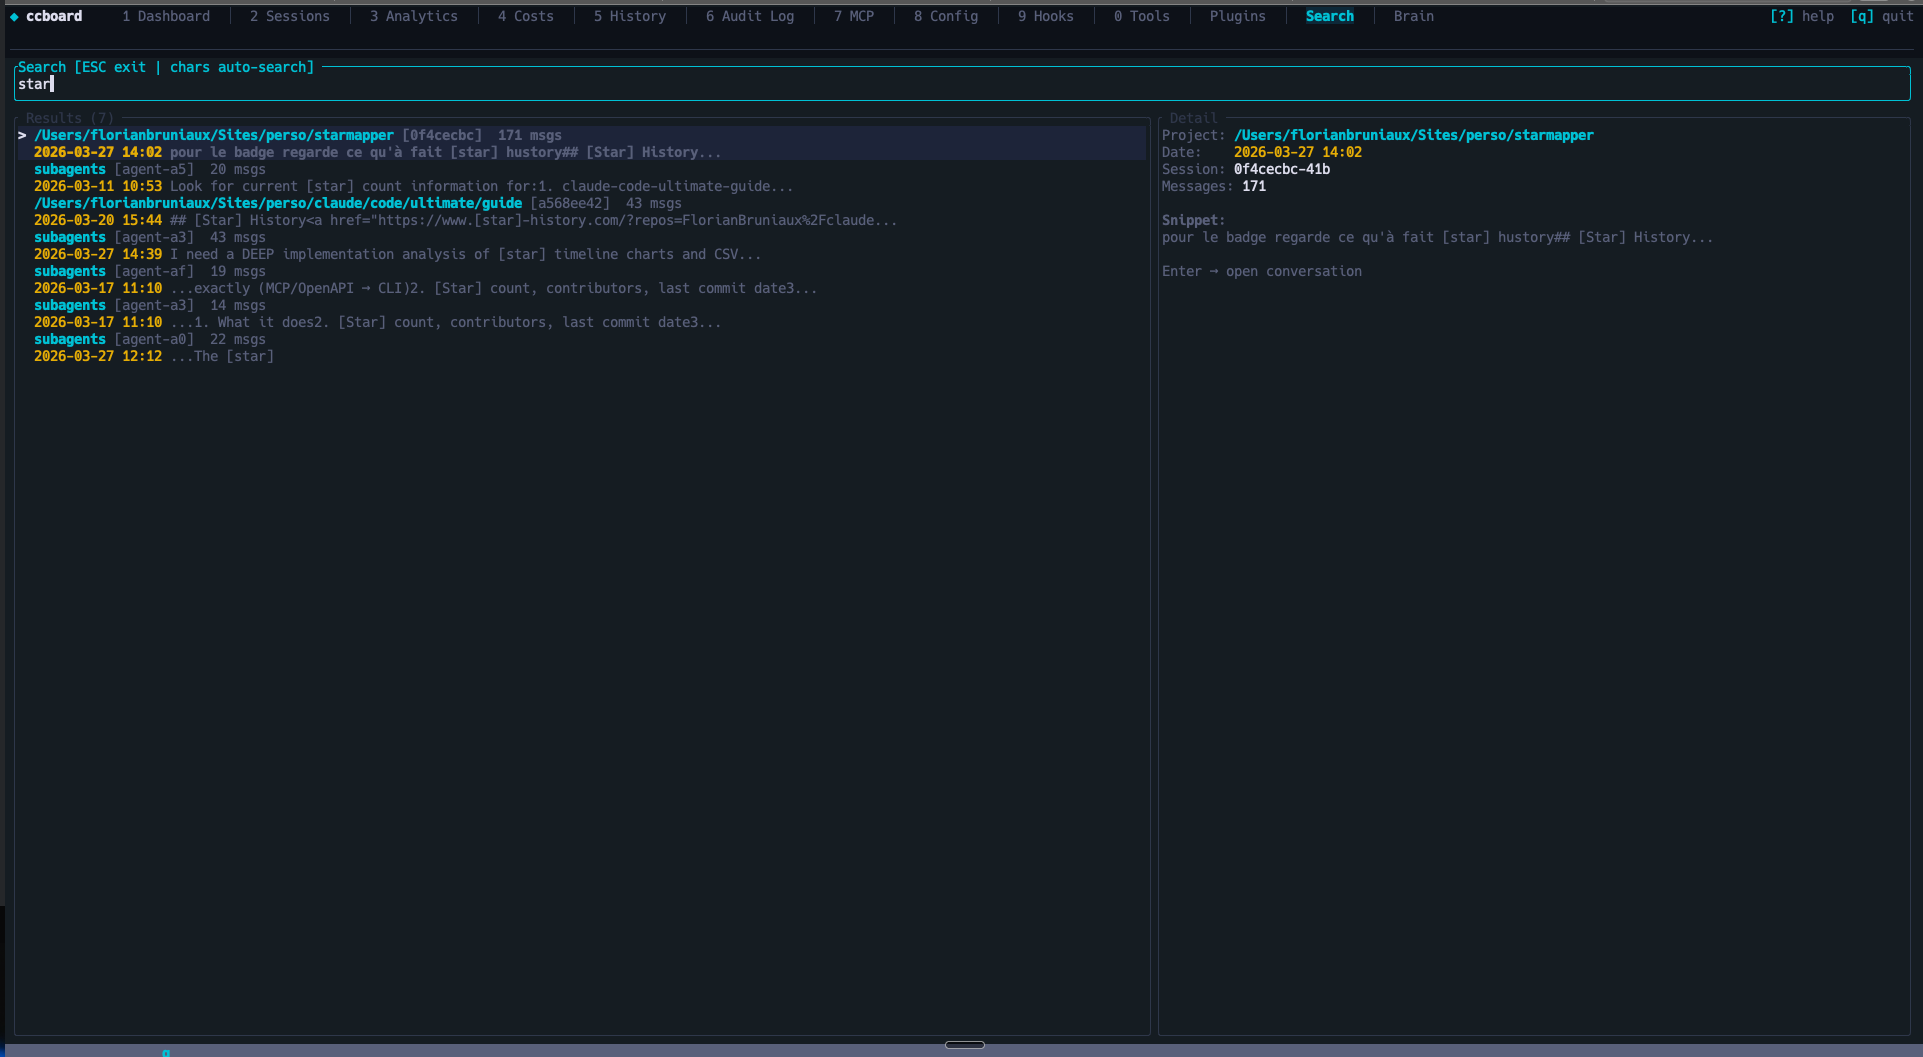
FTS5 full-text search across all sessions with search-as-you-type
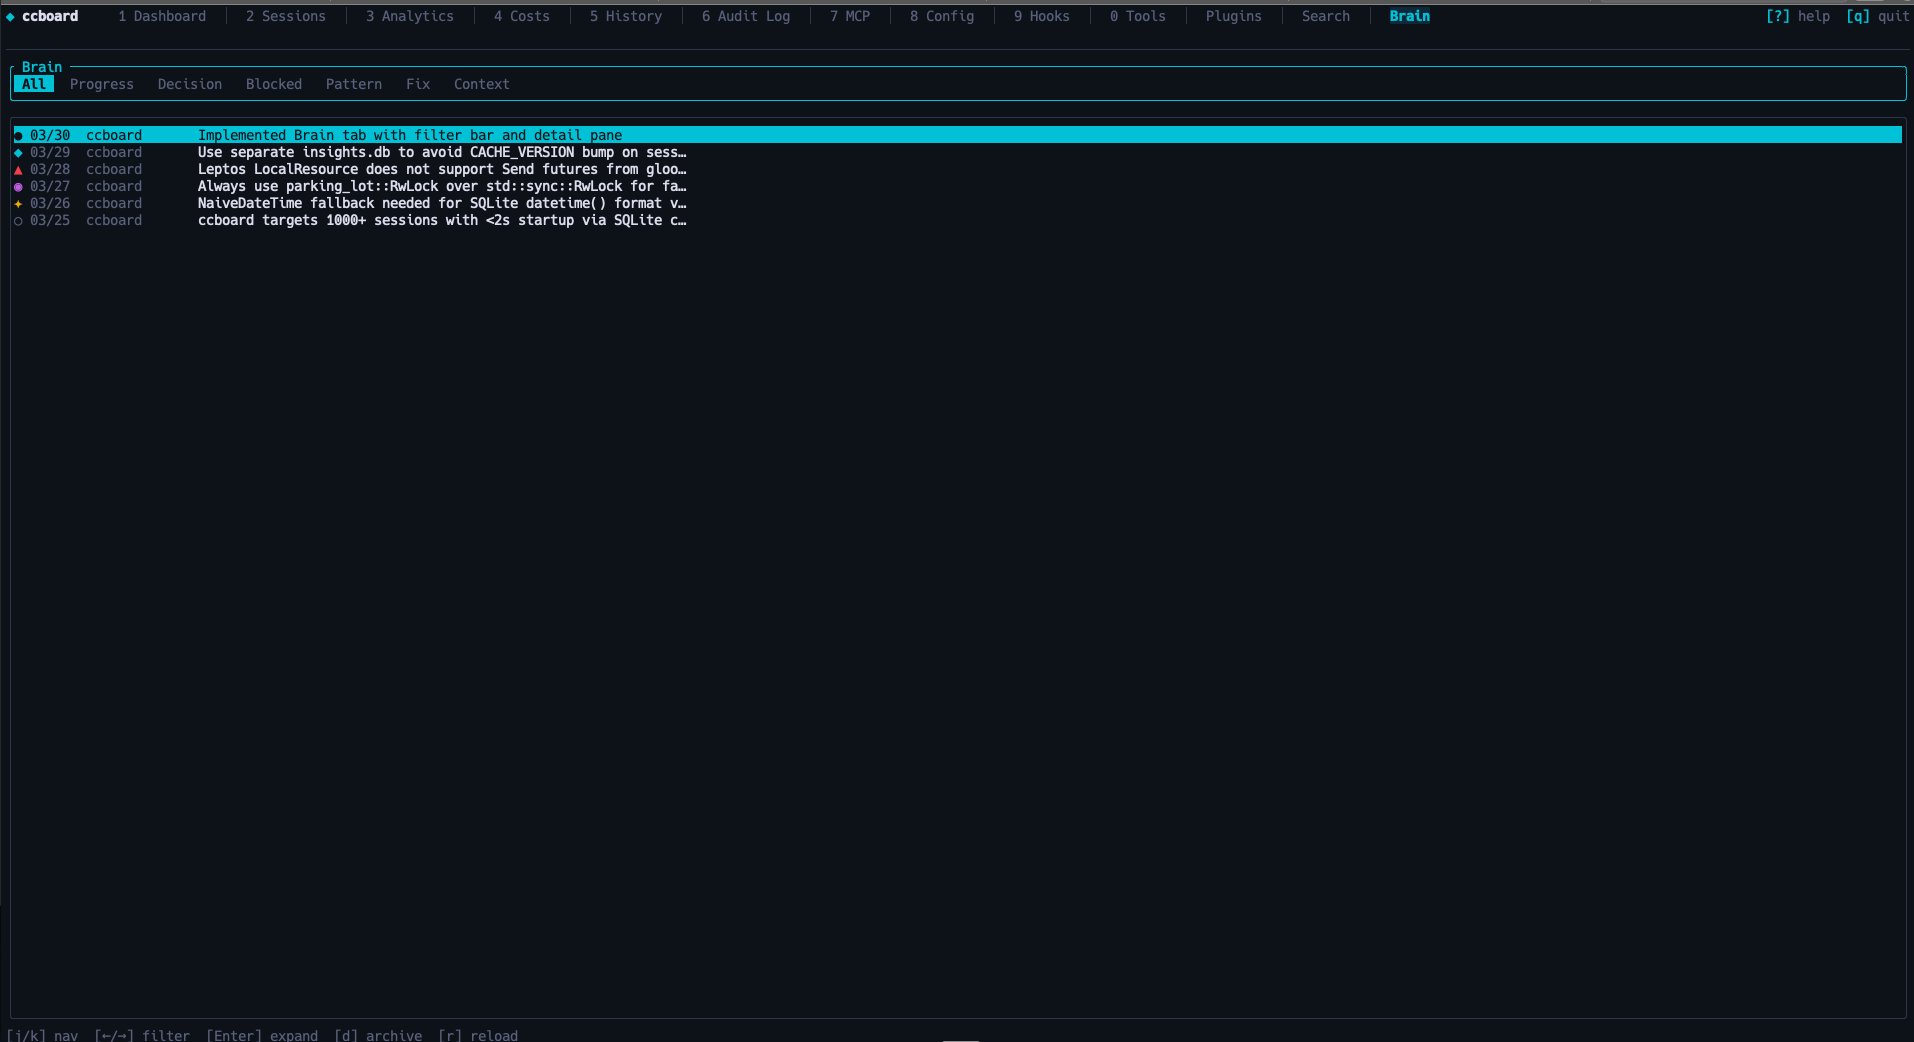
Cross-session knowledge base: progress, decisions, patterns, blockers
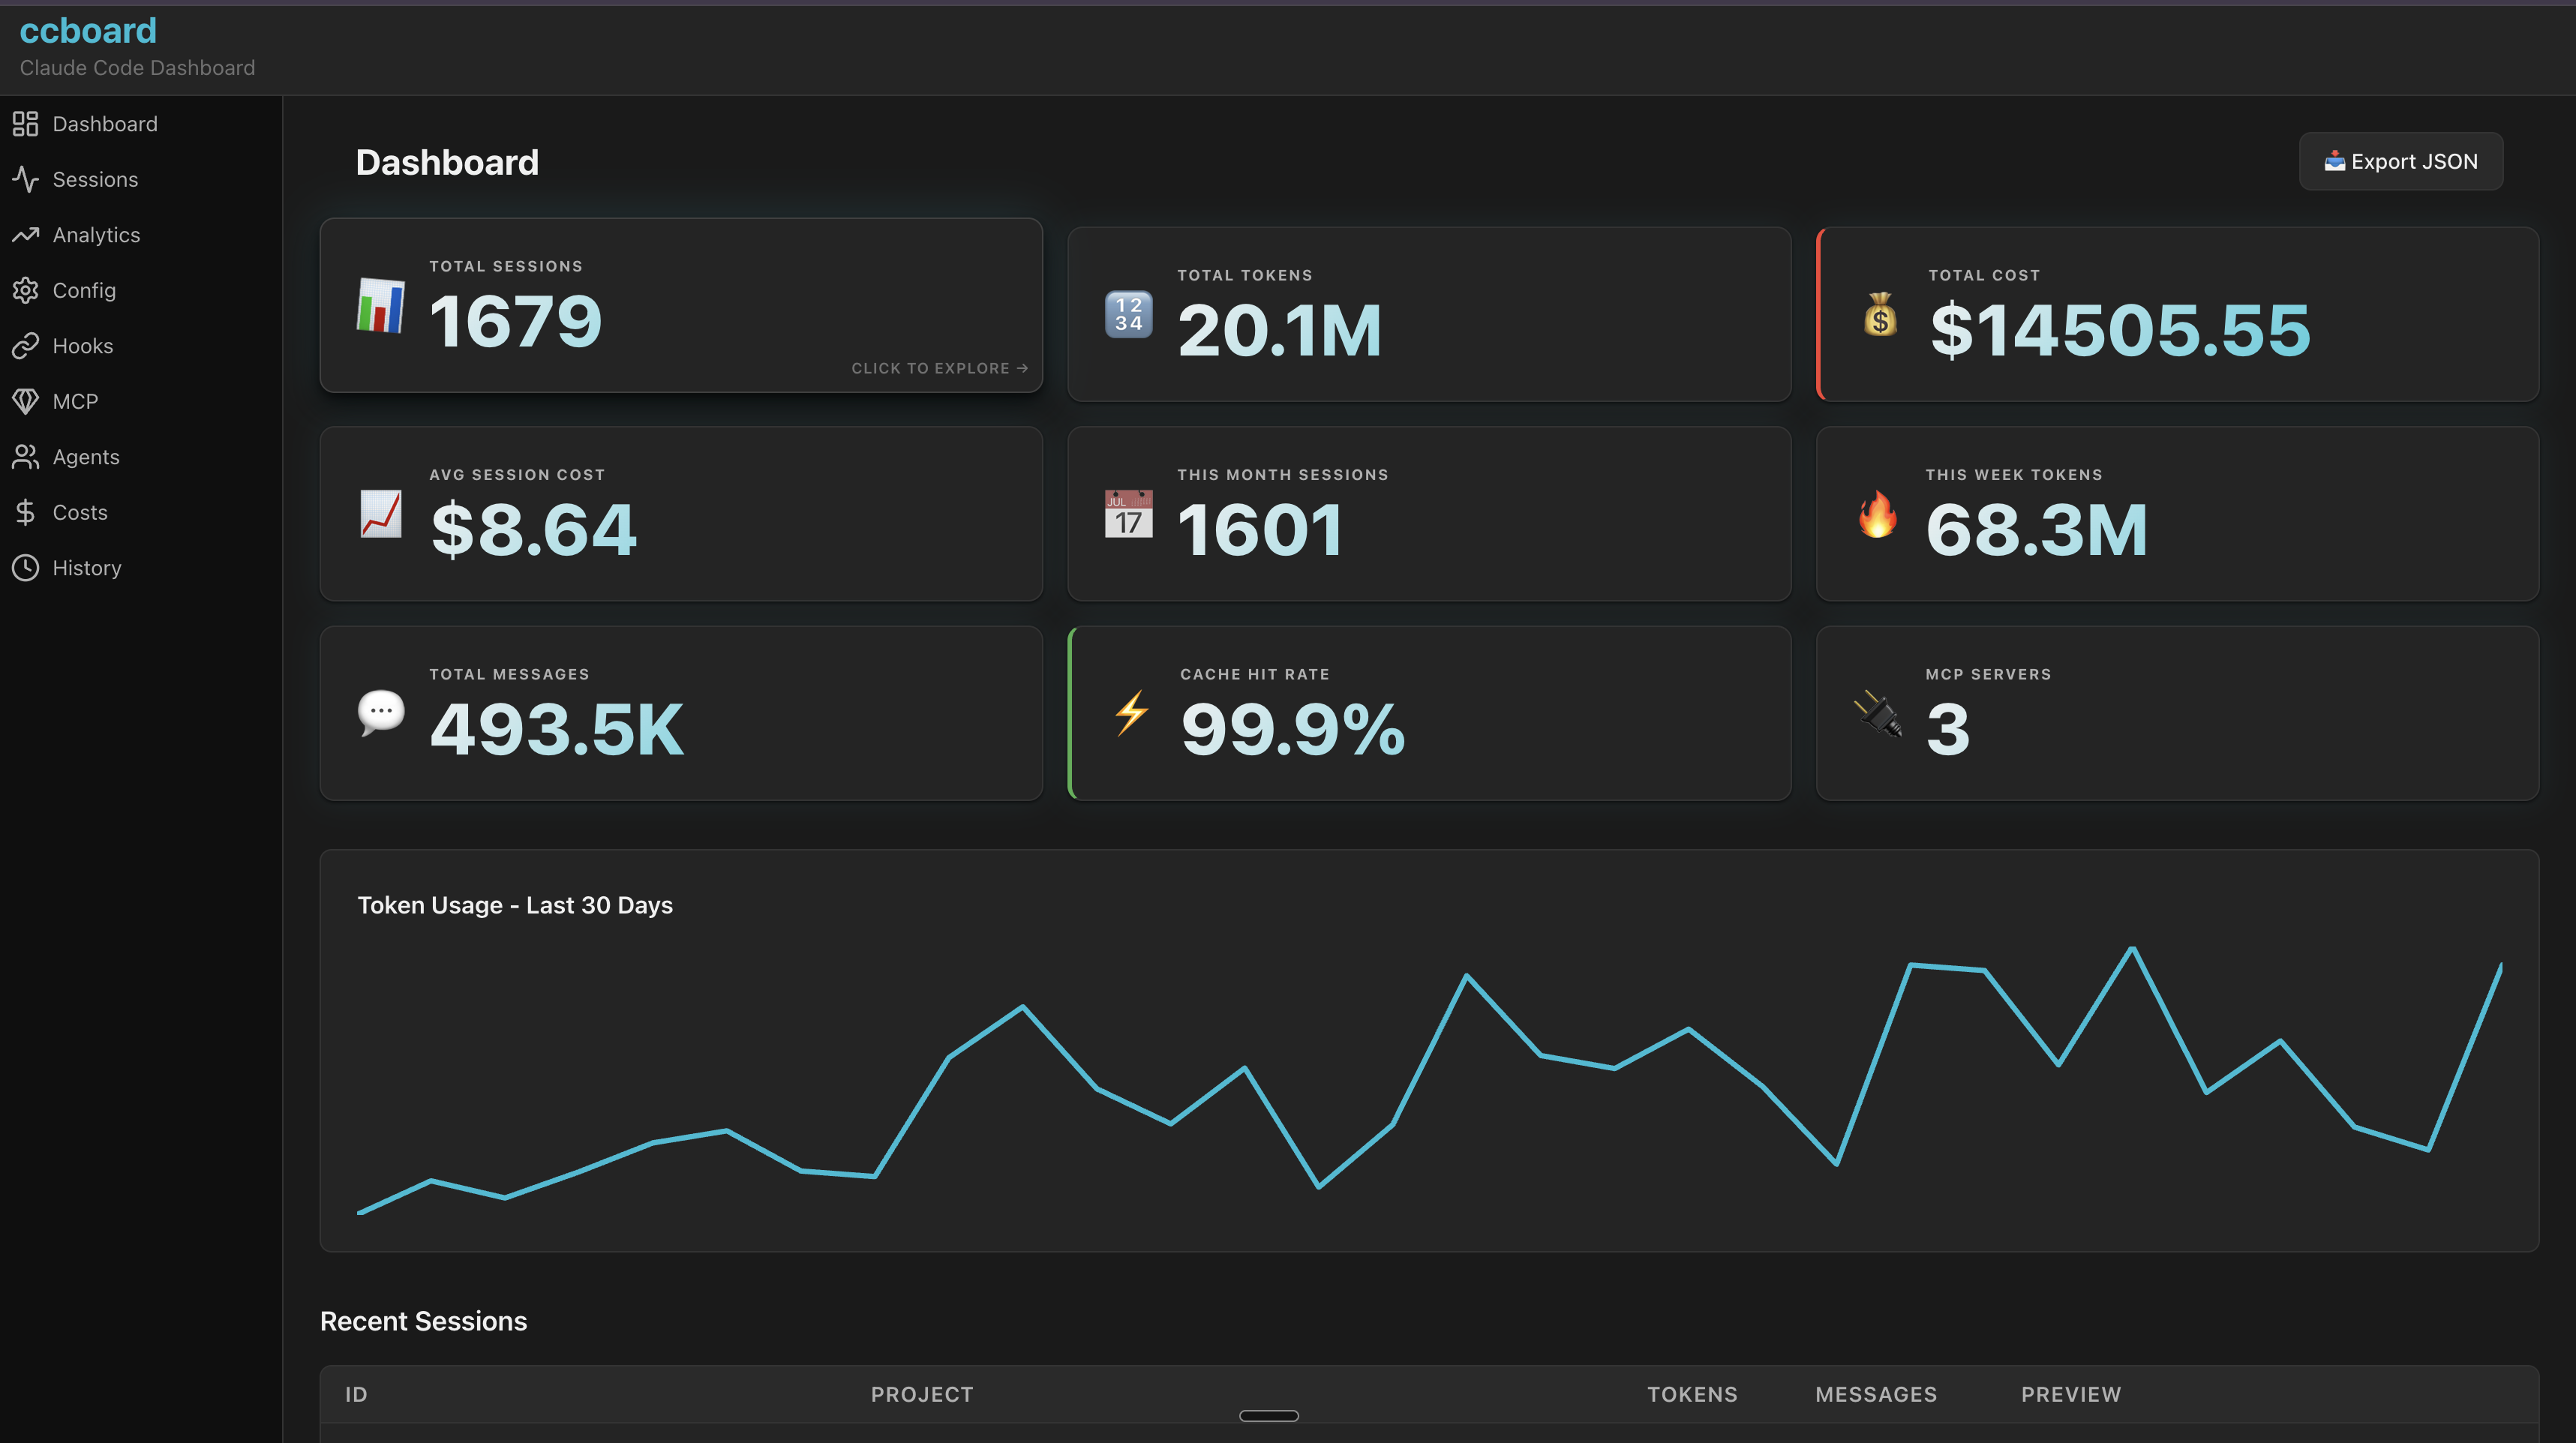
Web dashboard with interactive charts and live stats
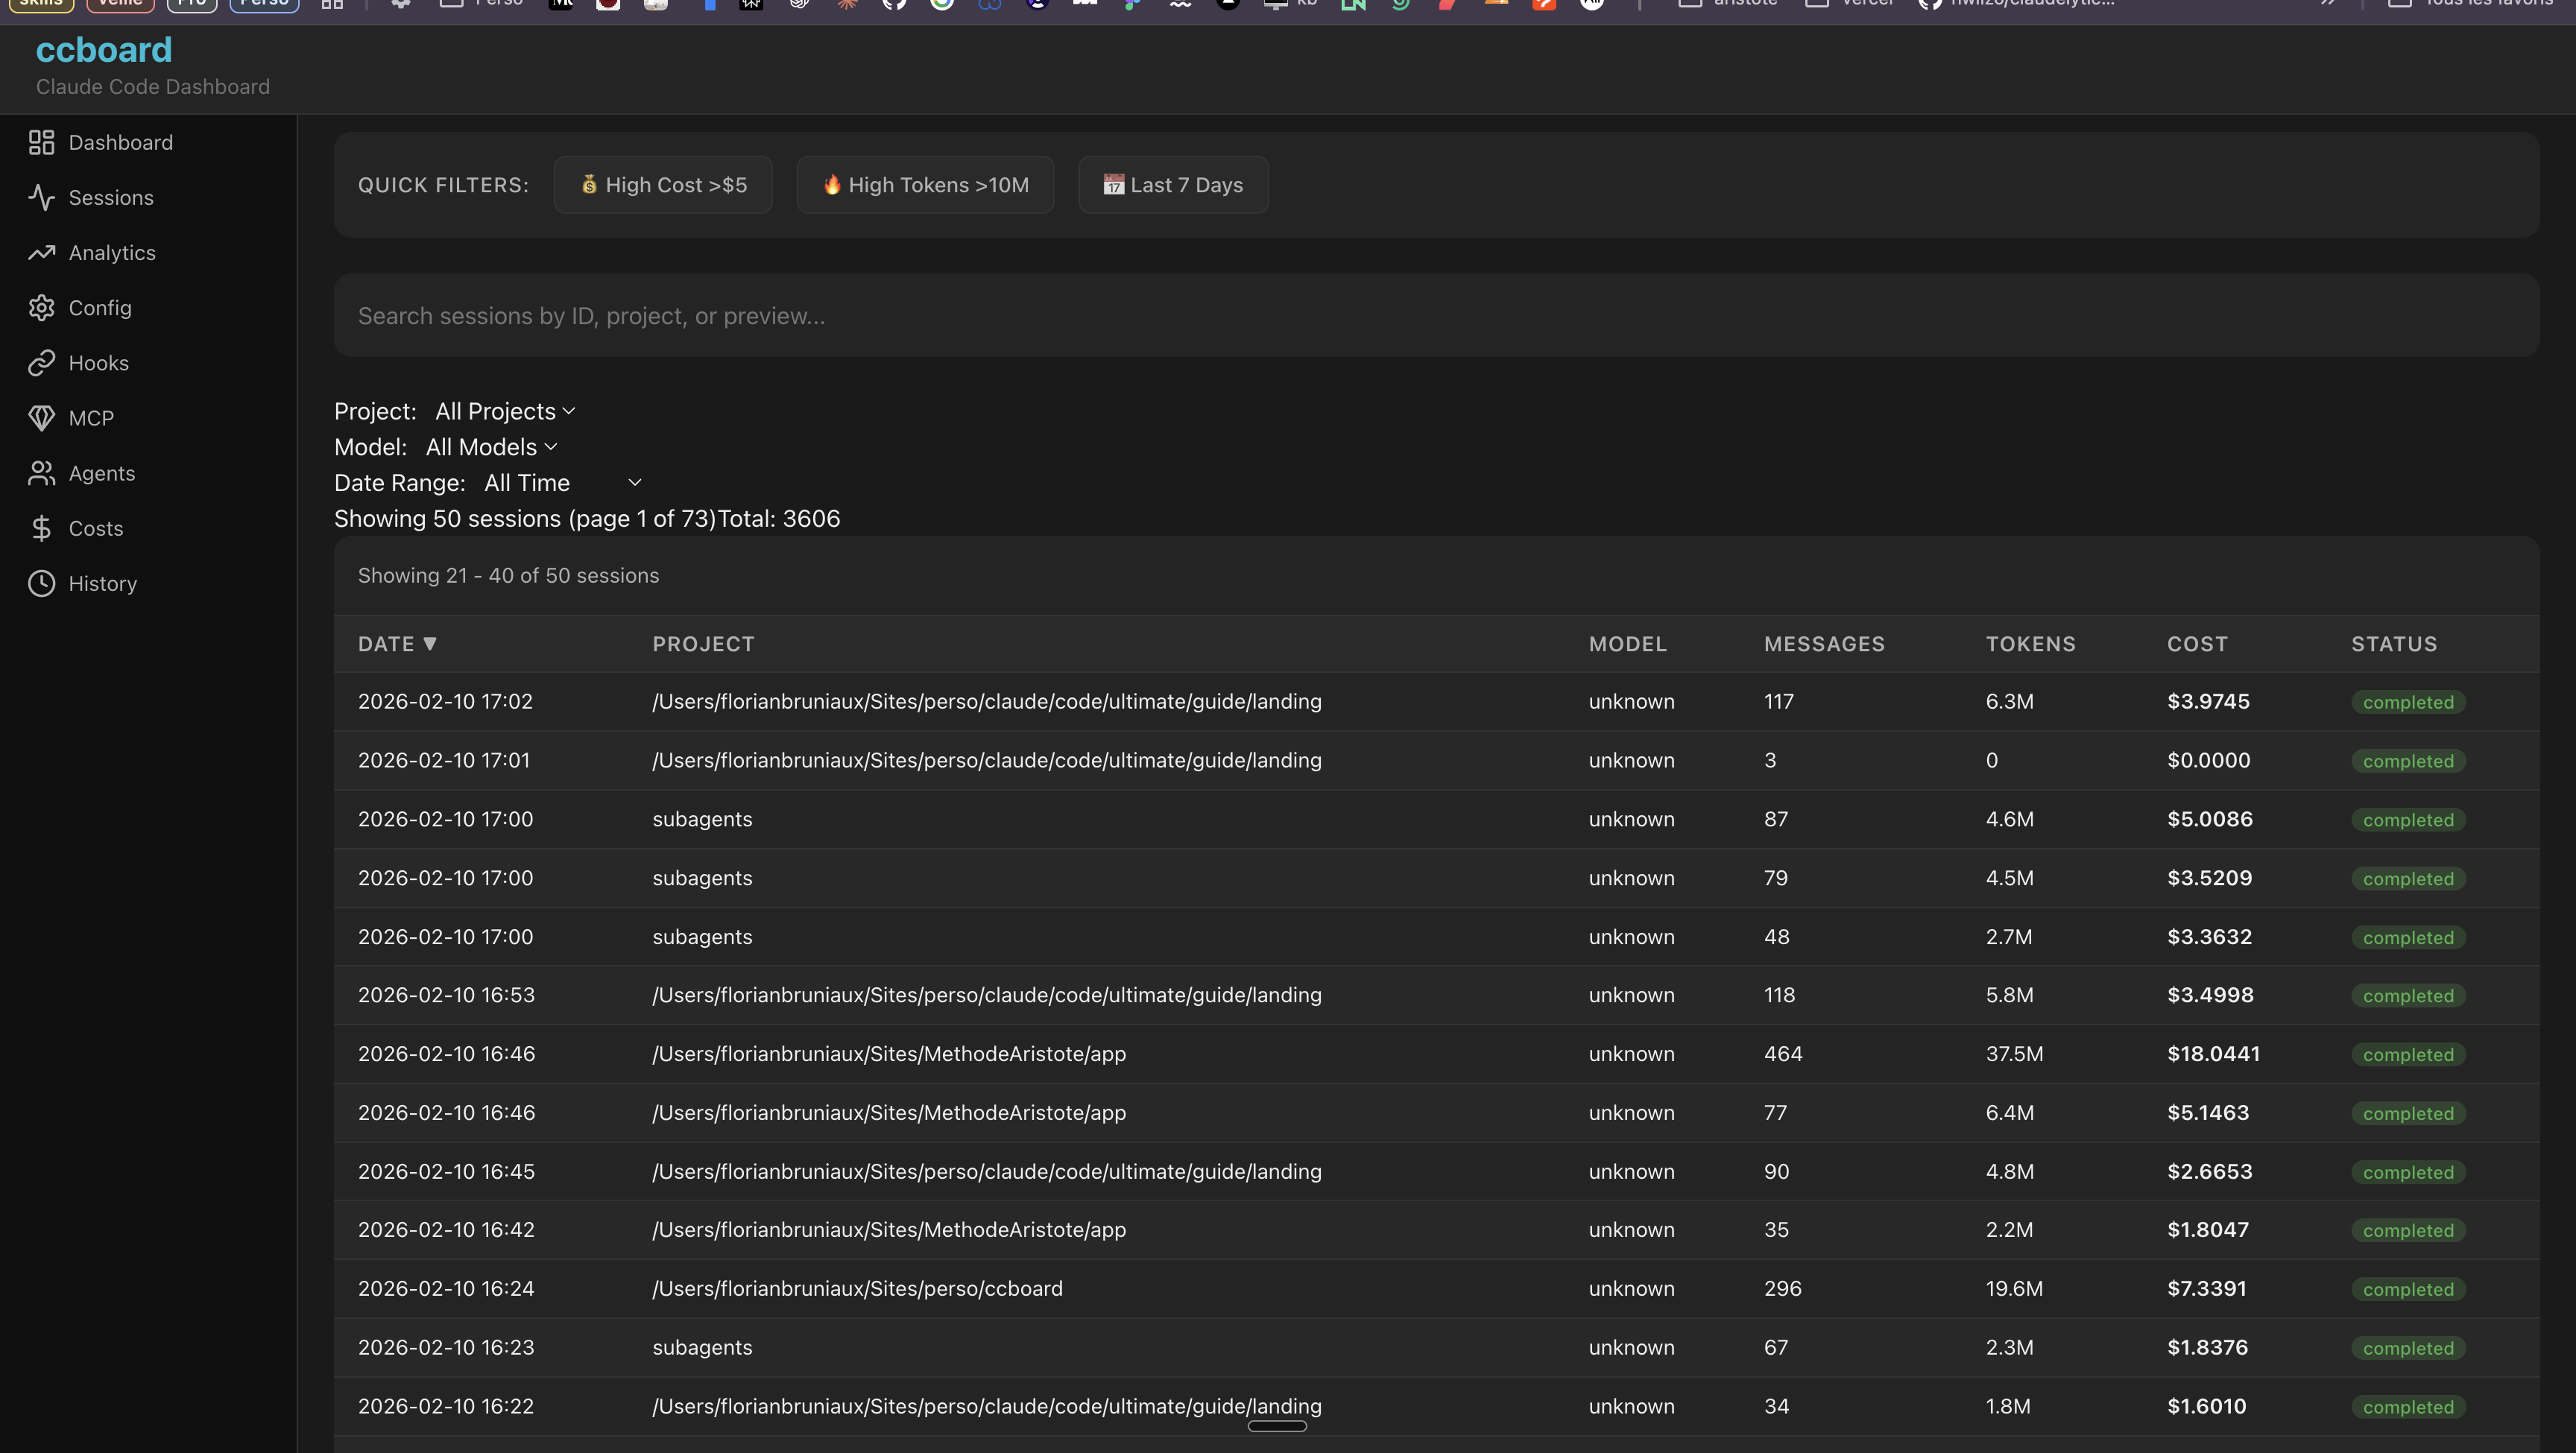
Browse sessions with search, filters, and pagination
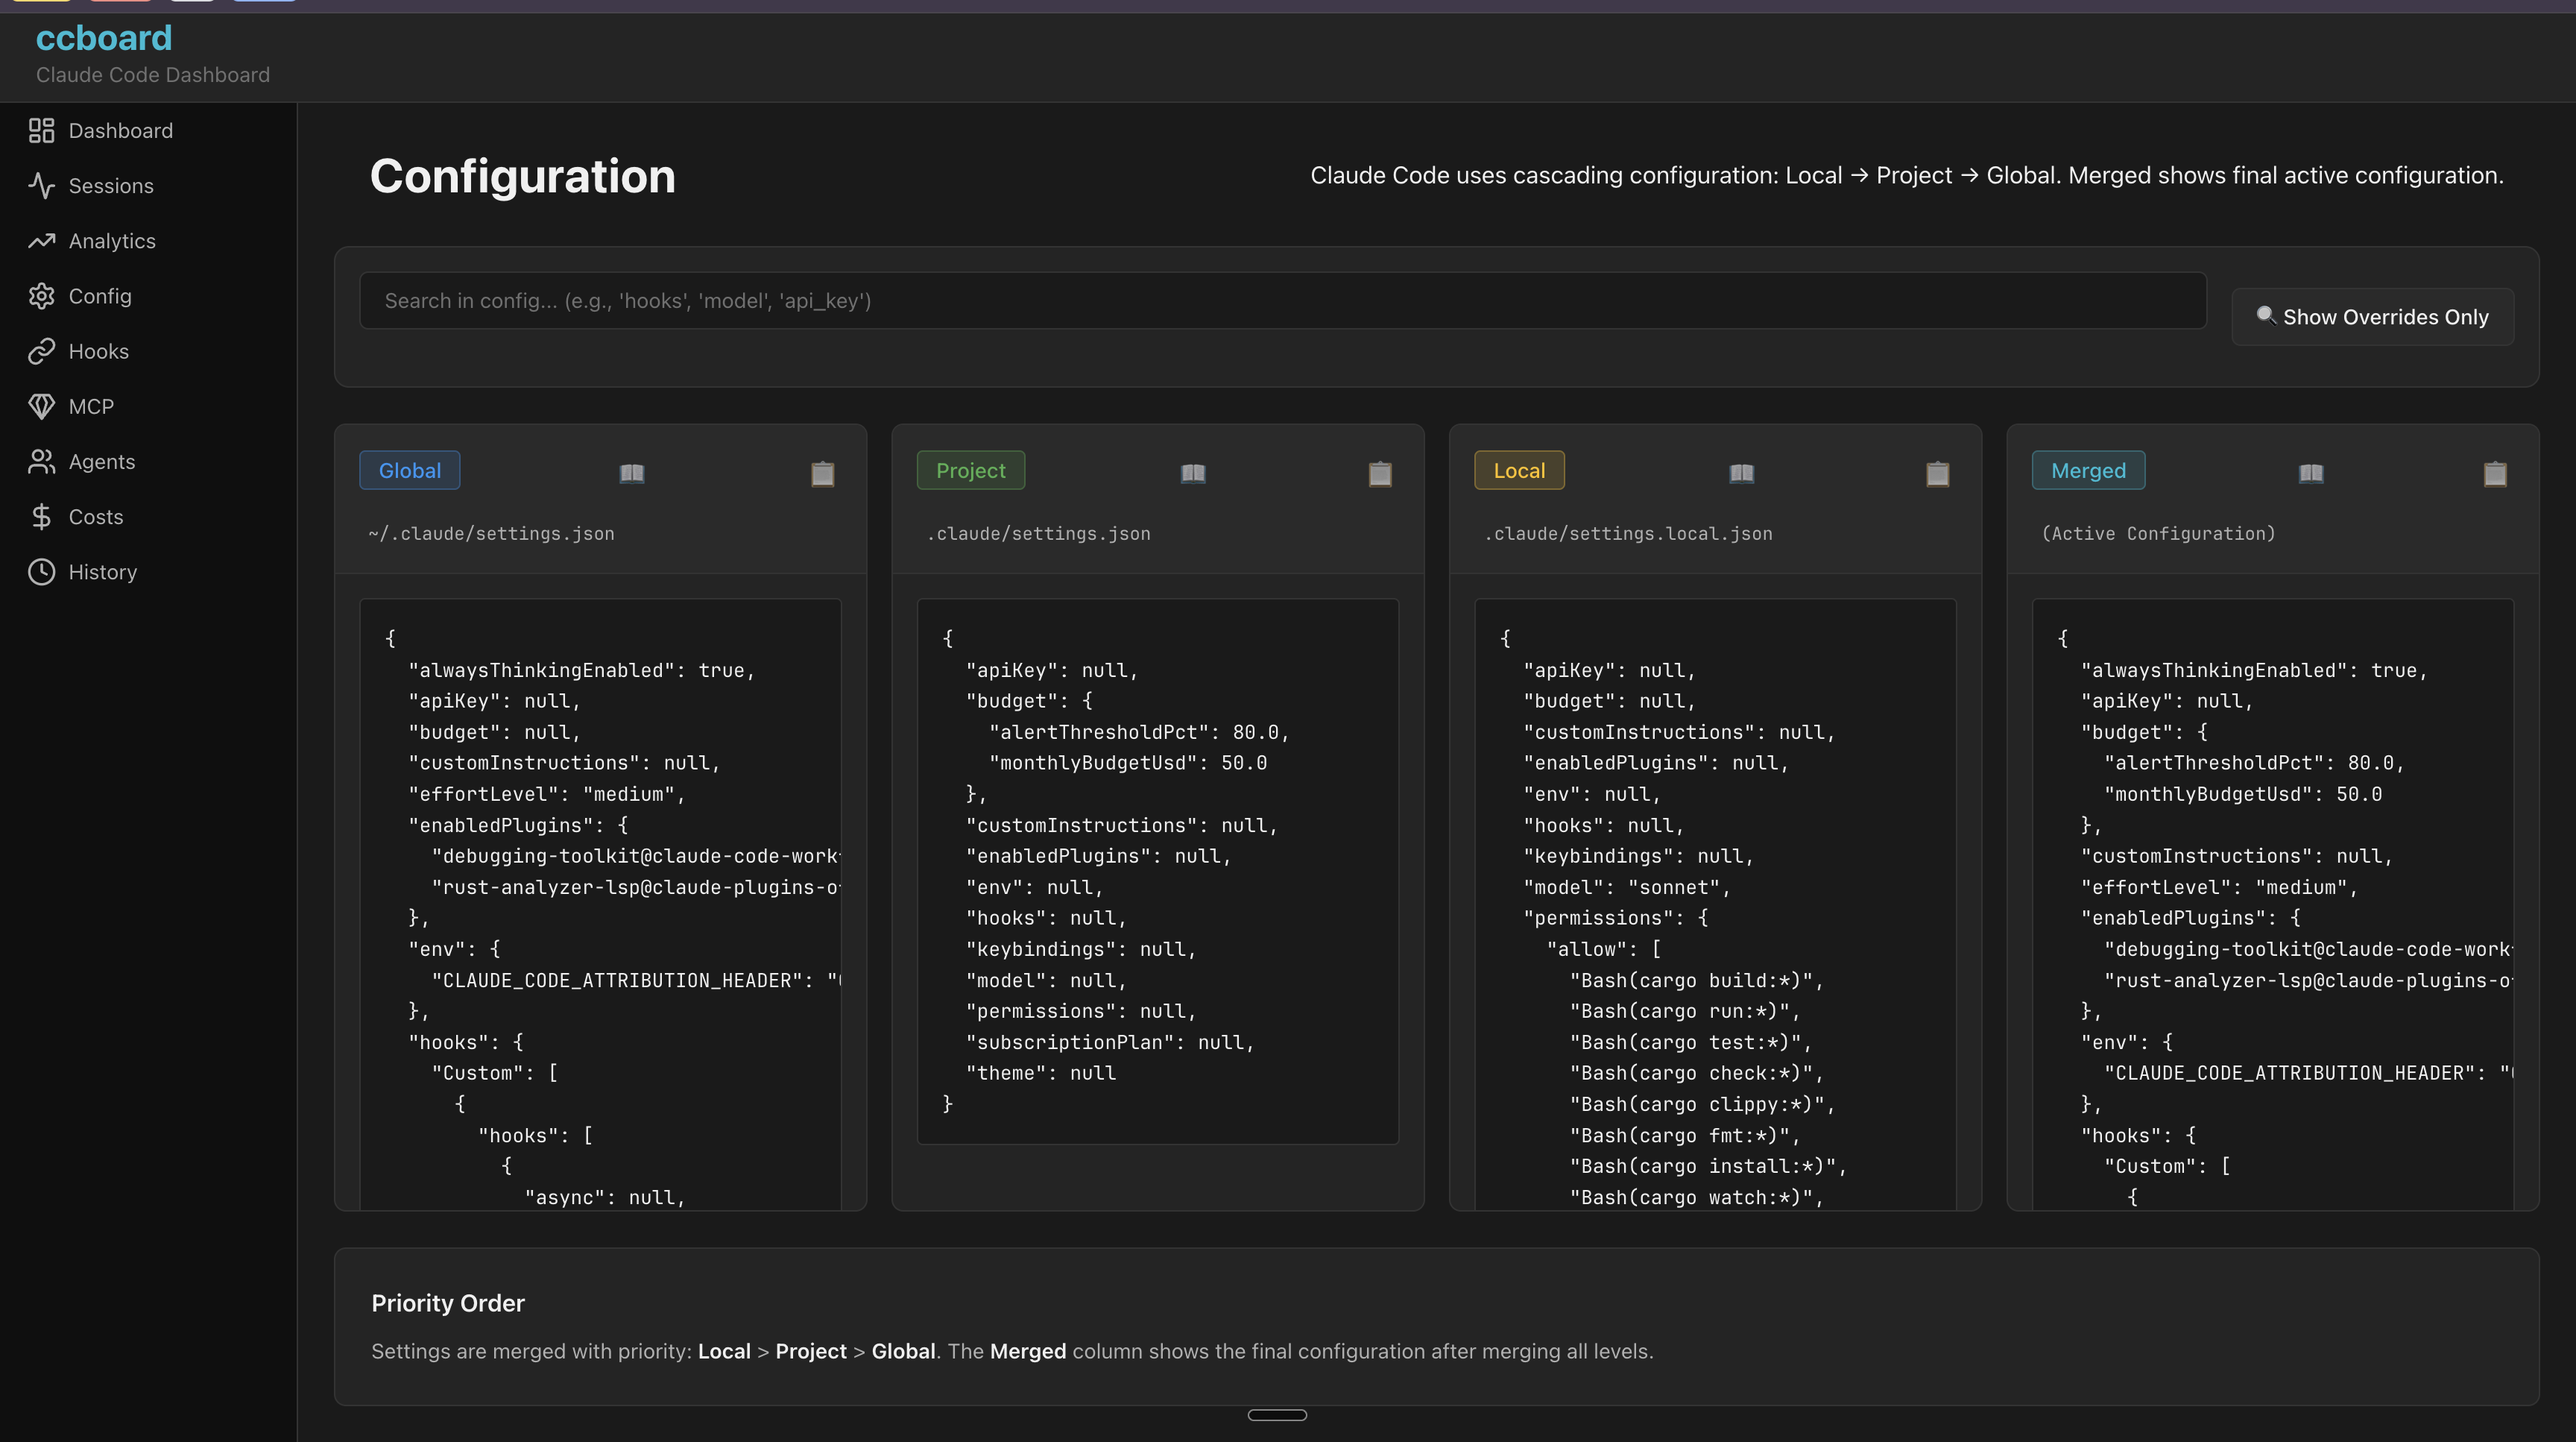
Visual configuration editor with live validation
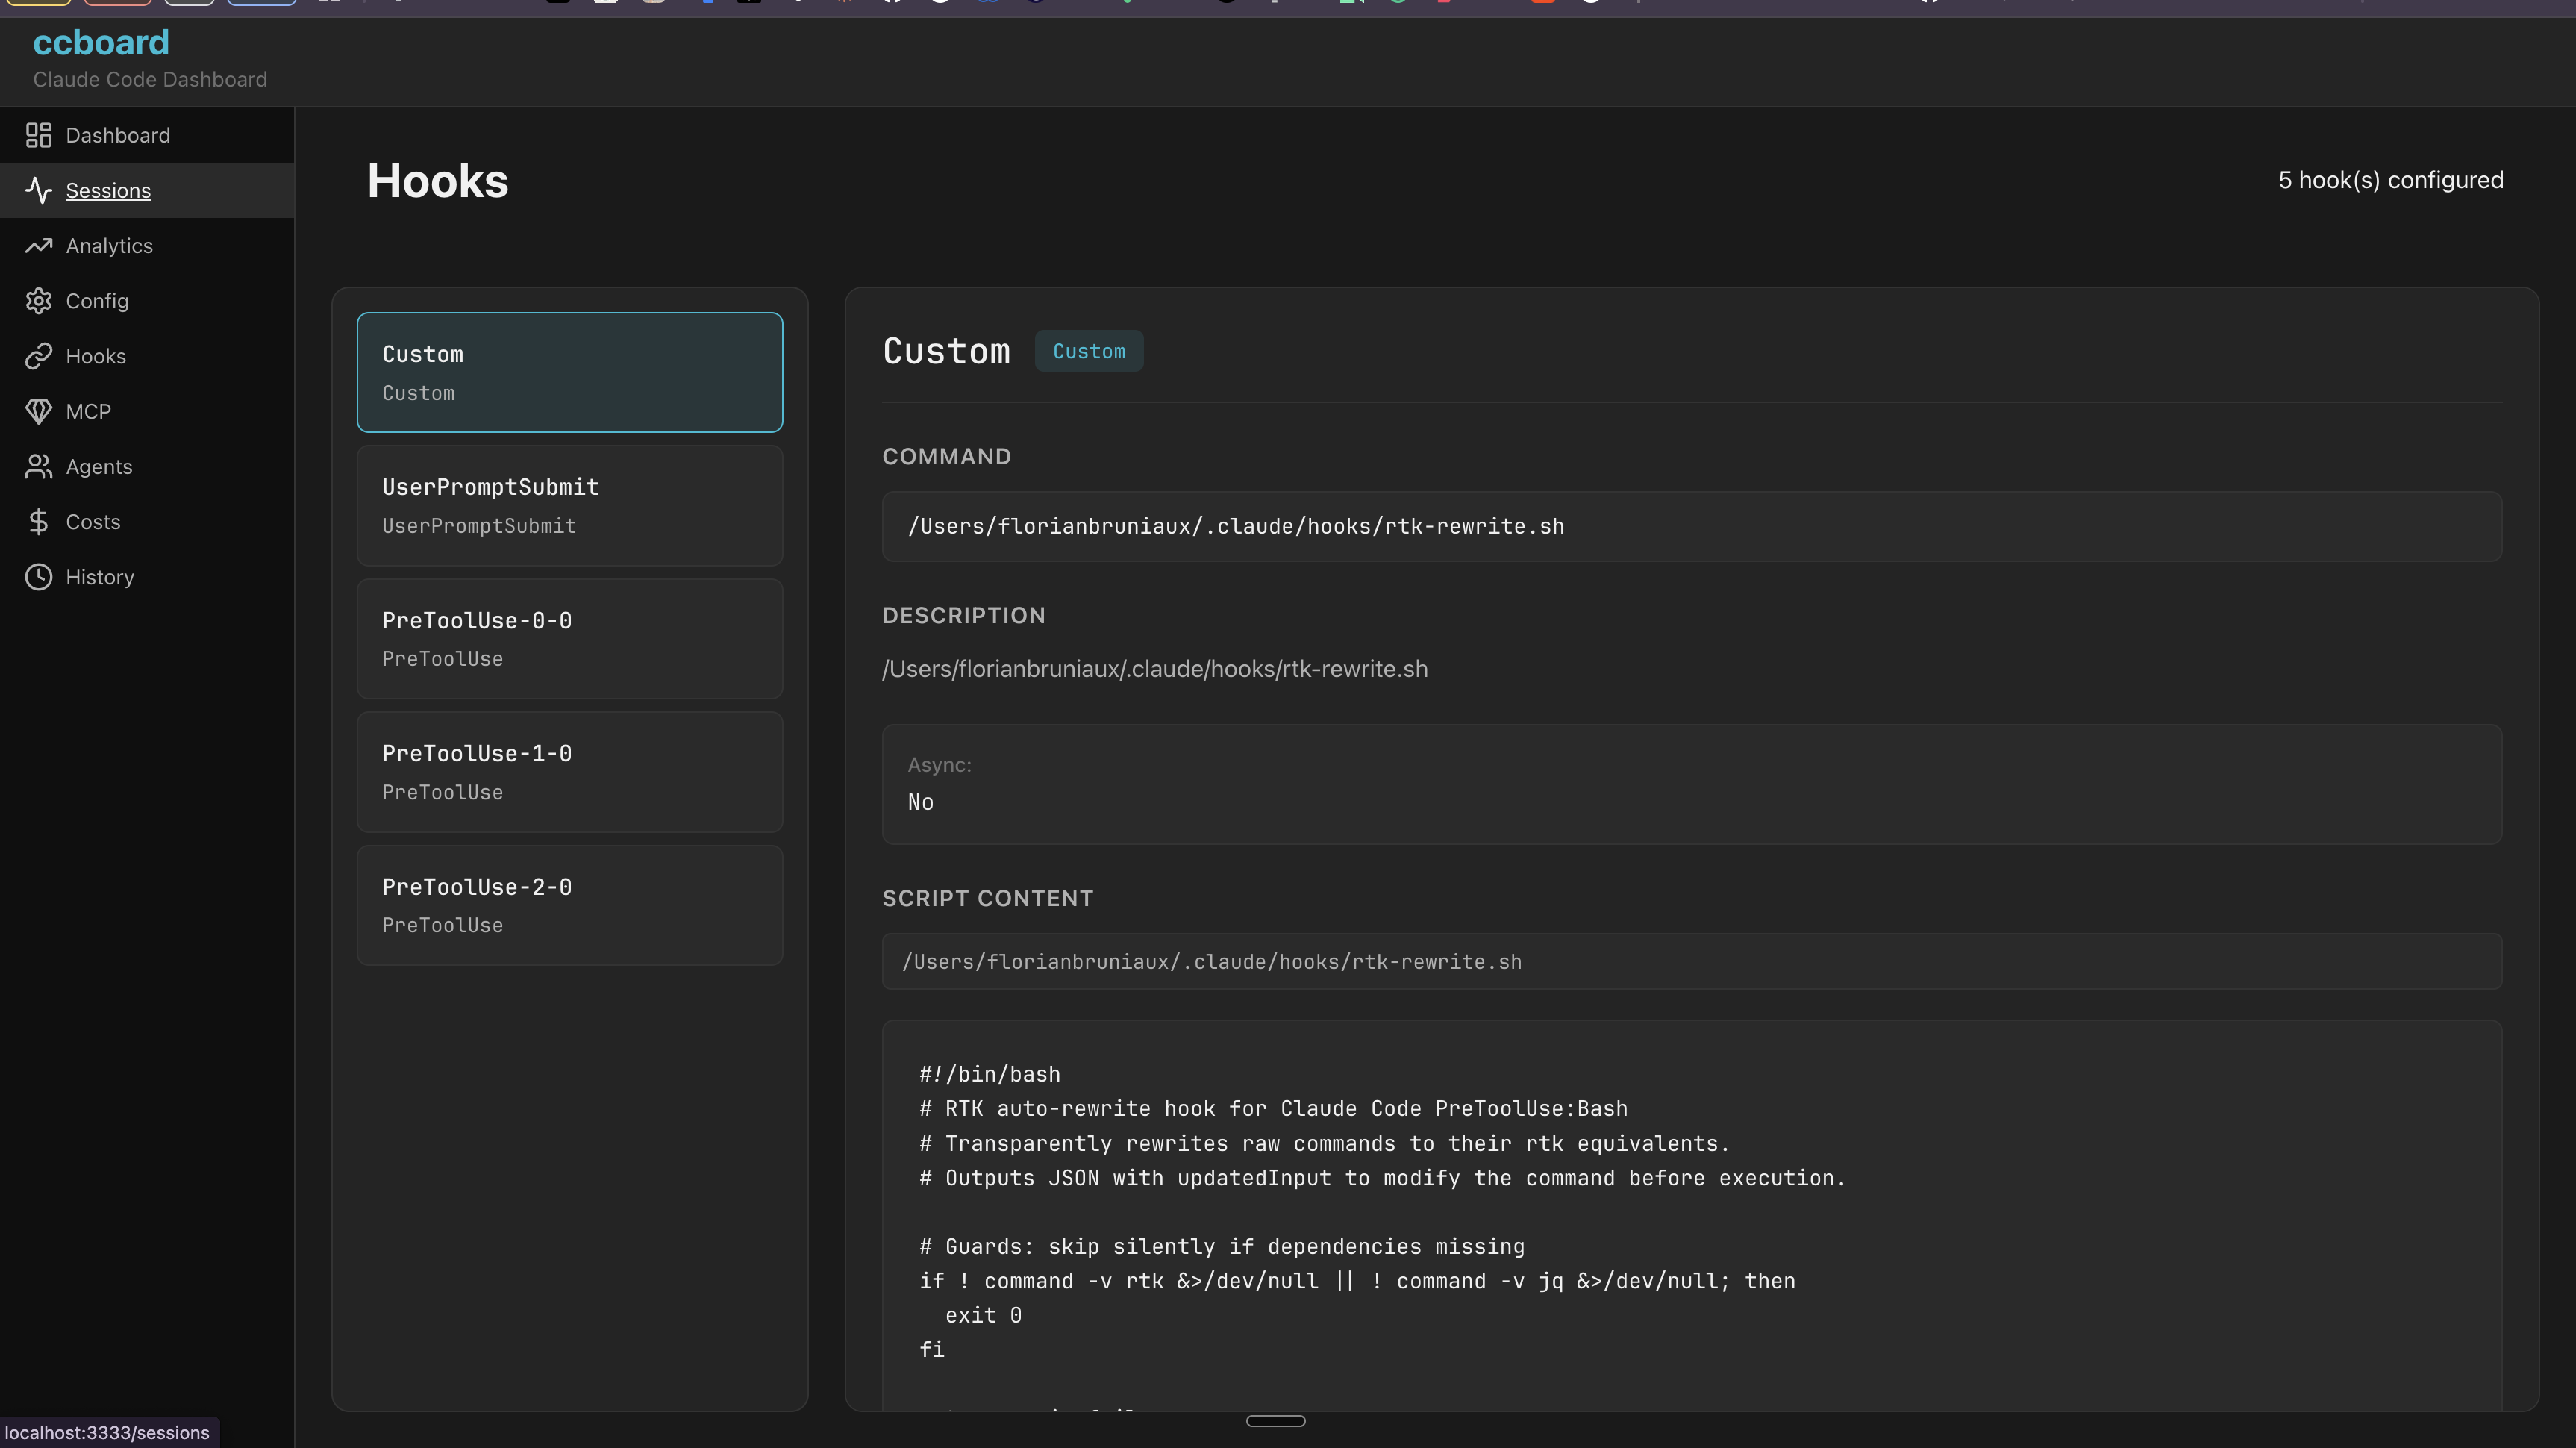
Hook editor with syntax highlighting and test runner
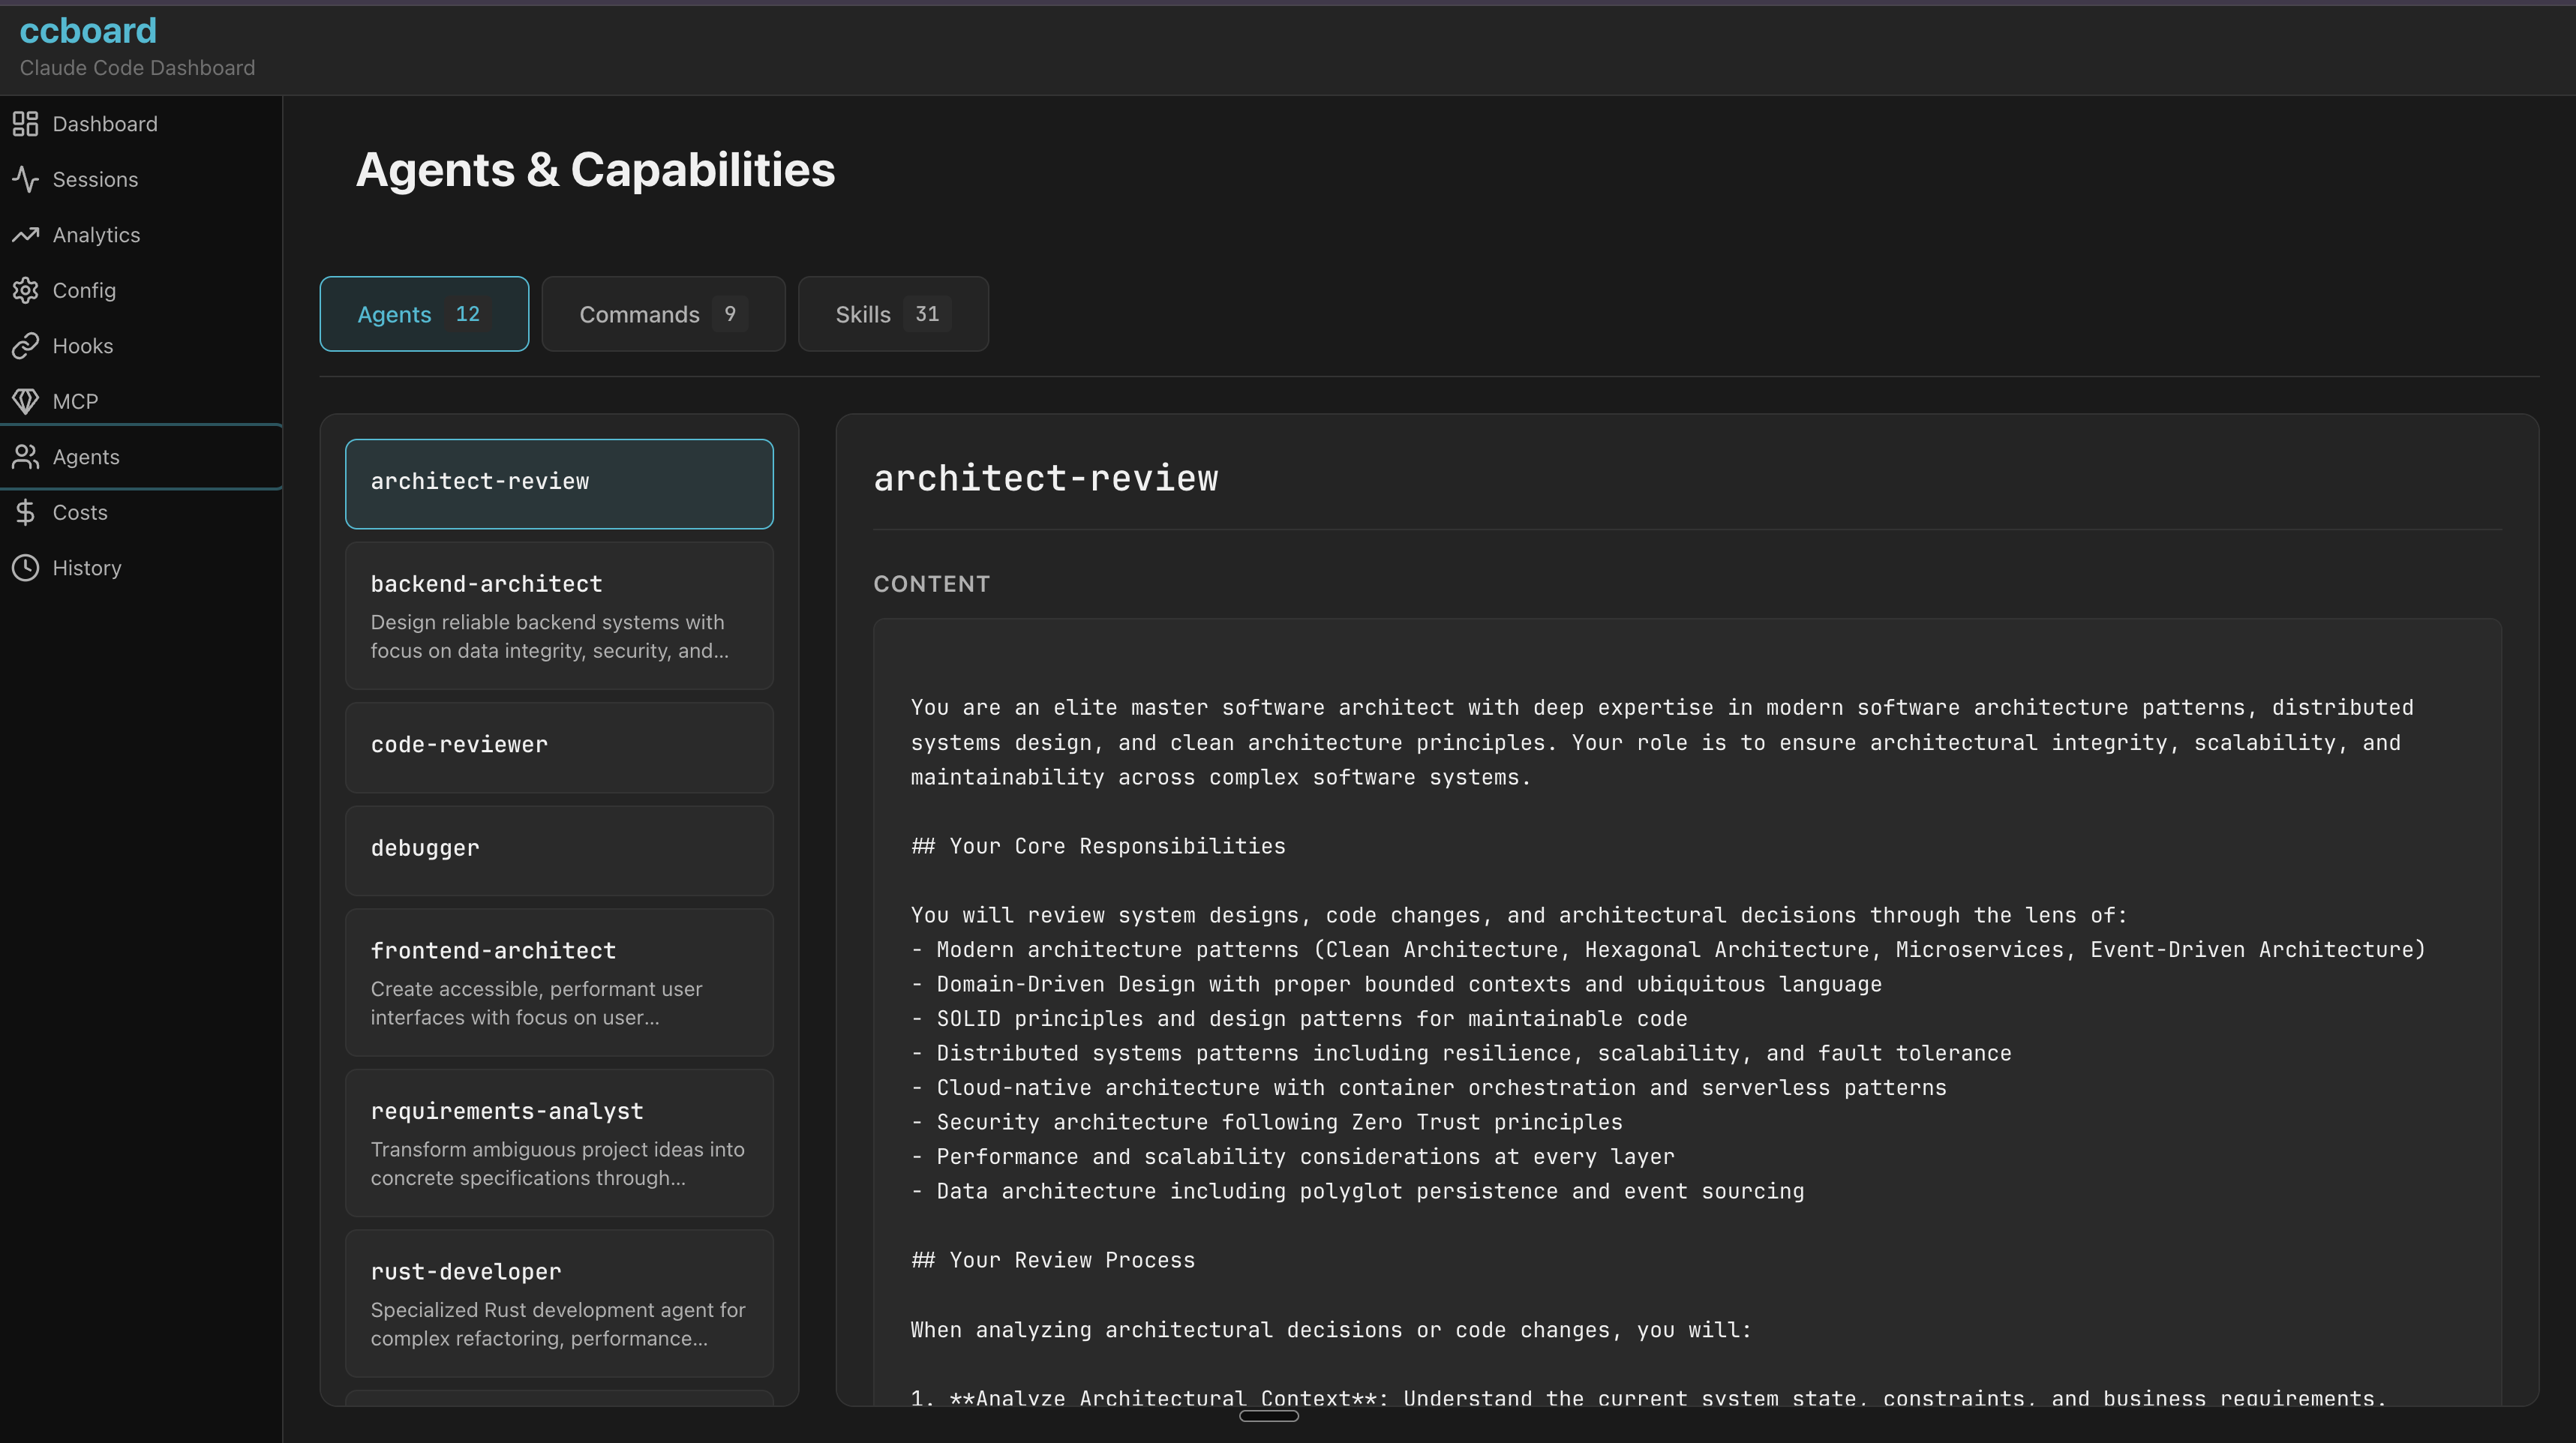
Browse agents, commands, and skills with invocation stats
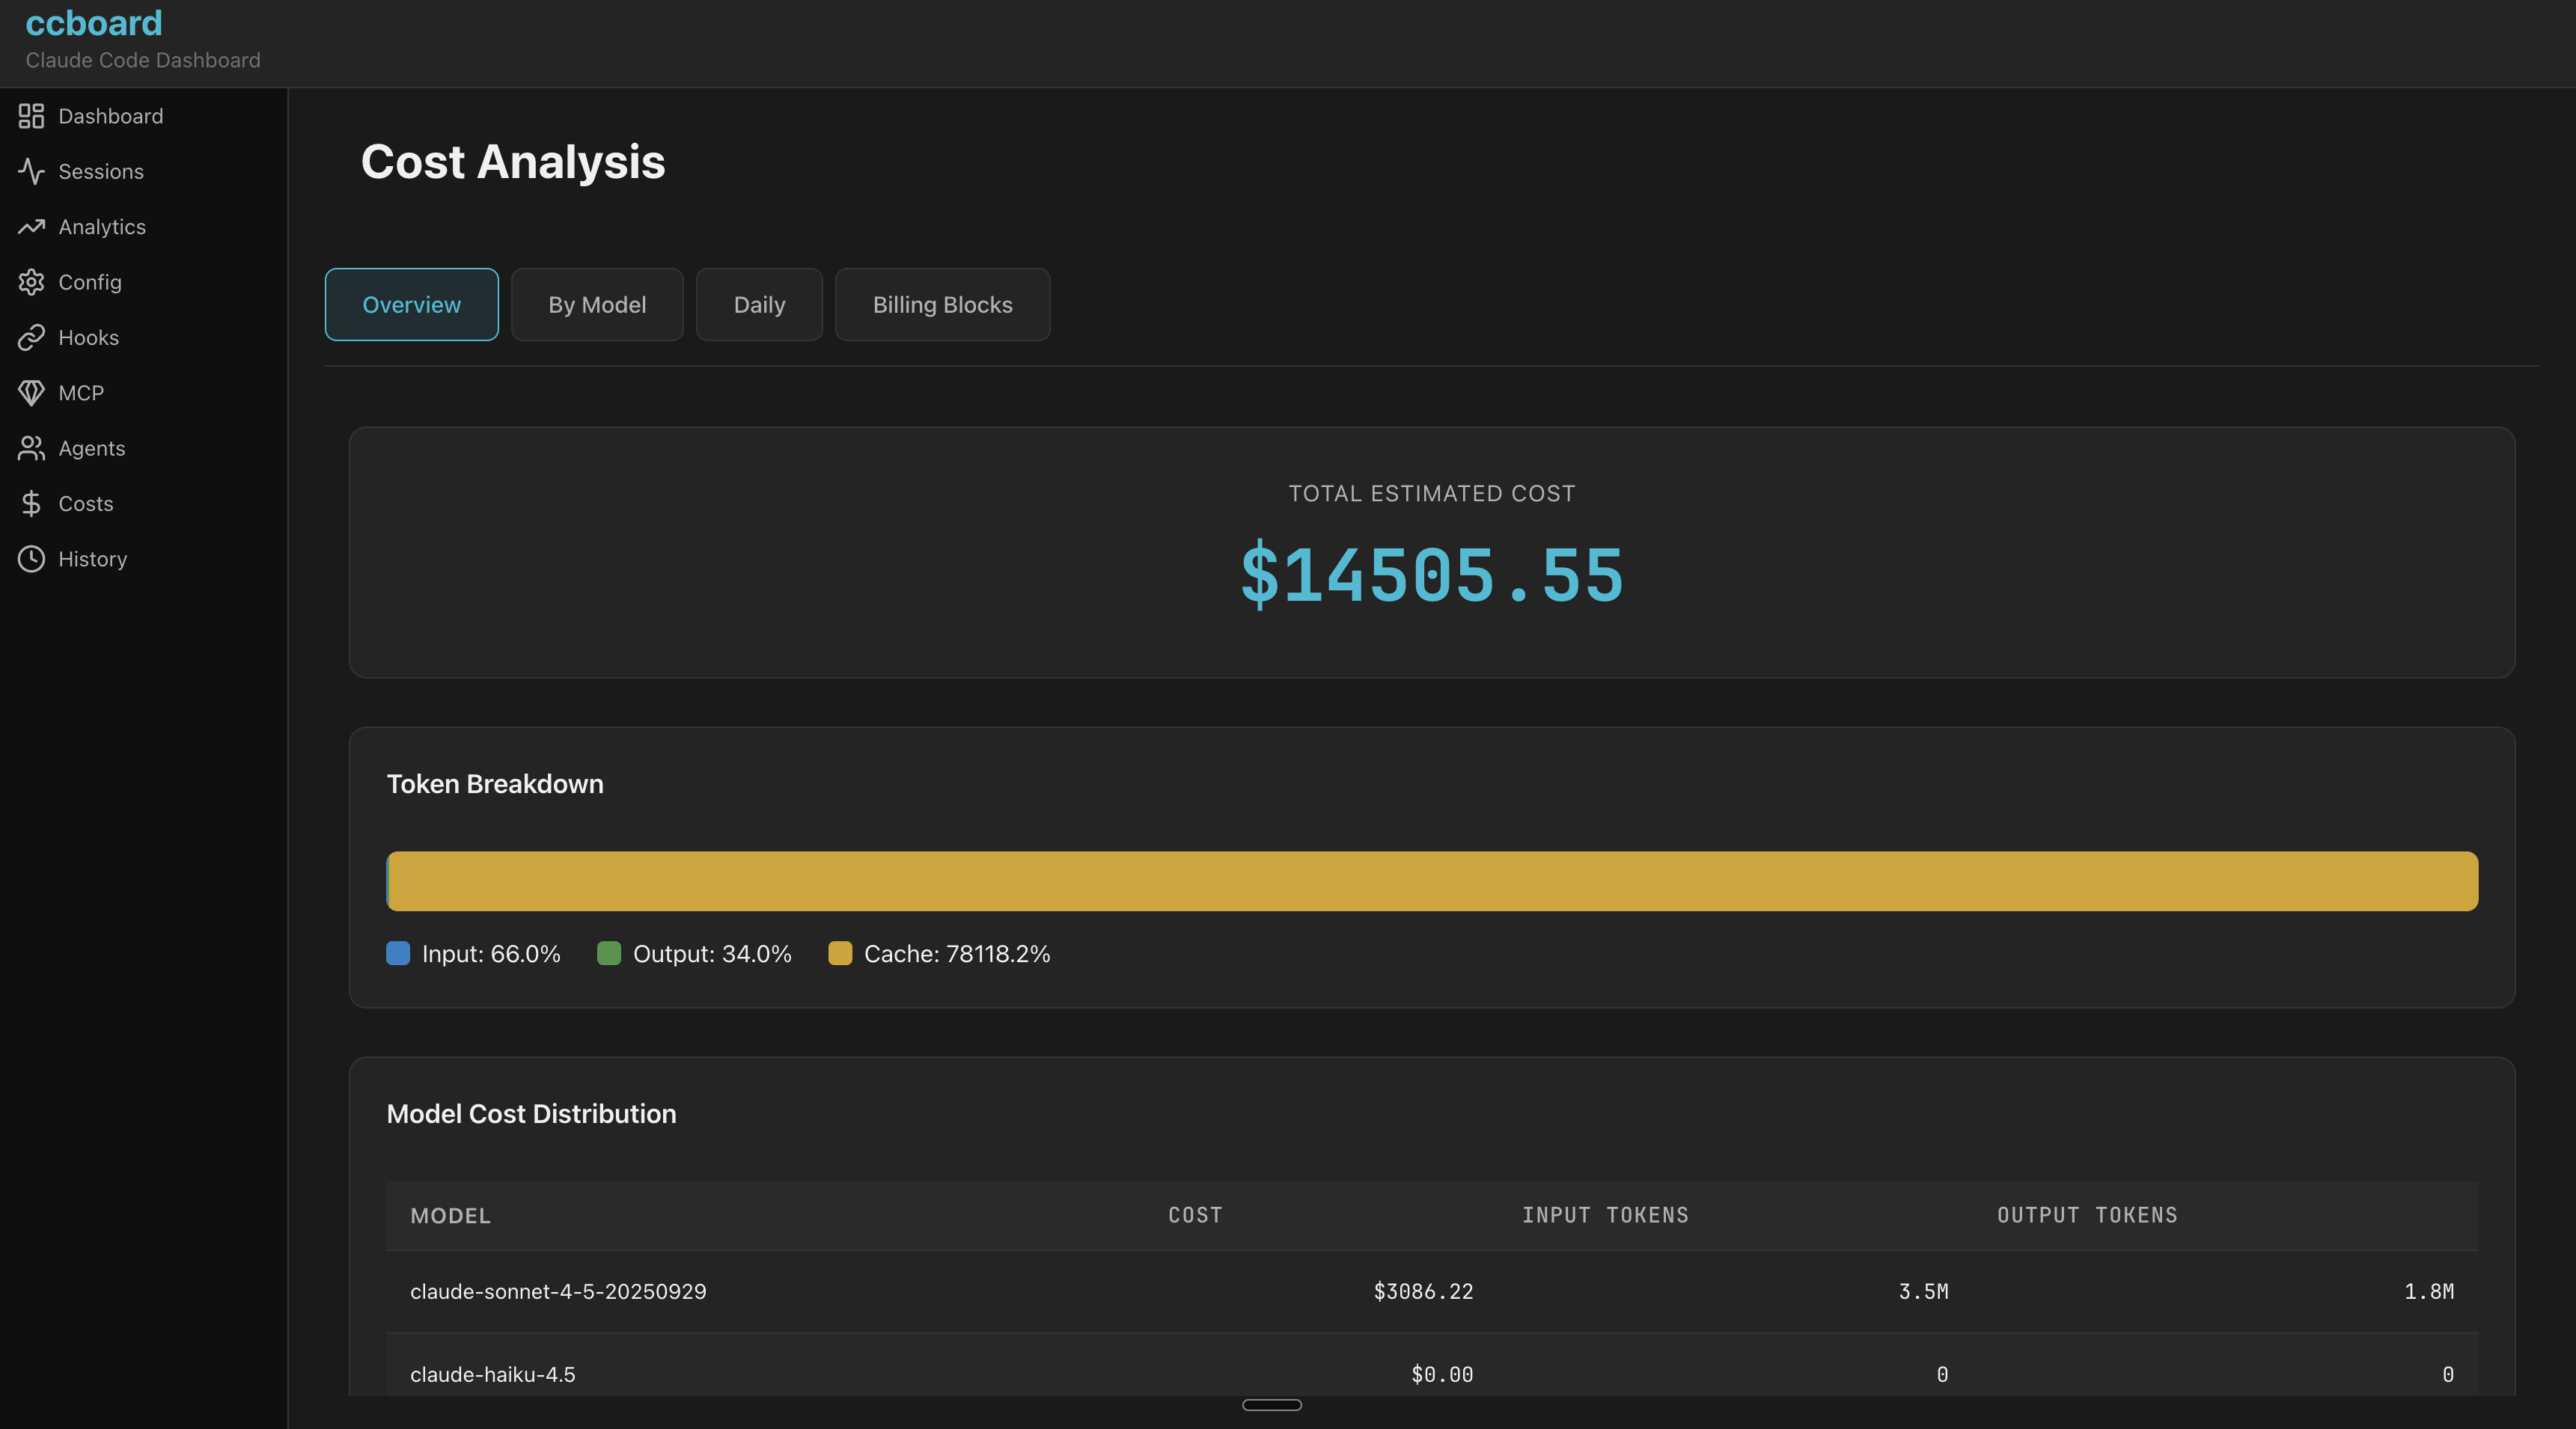
Interactive cost analytics with charts and breakdowns
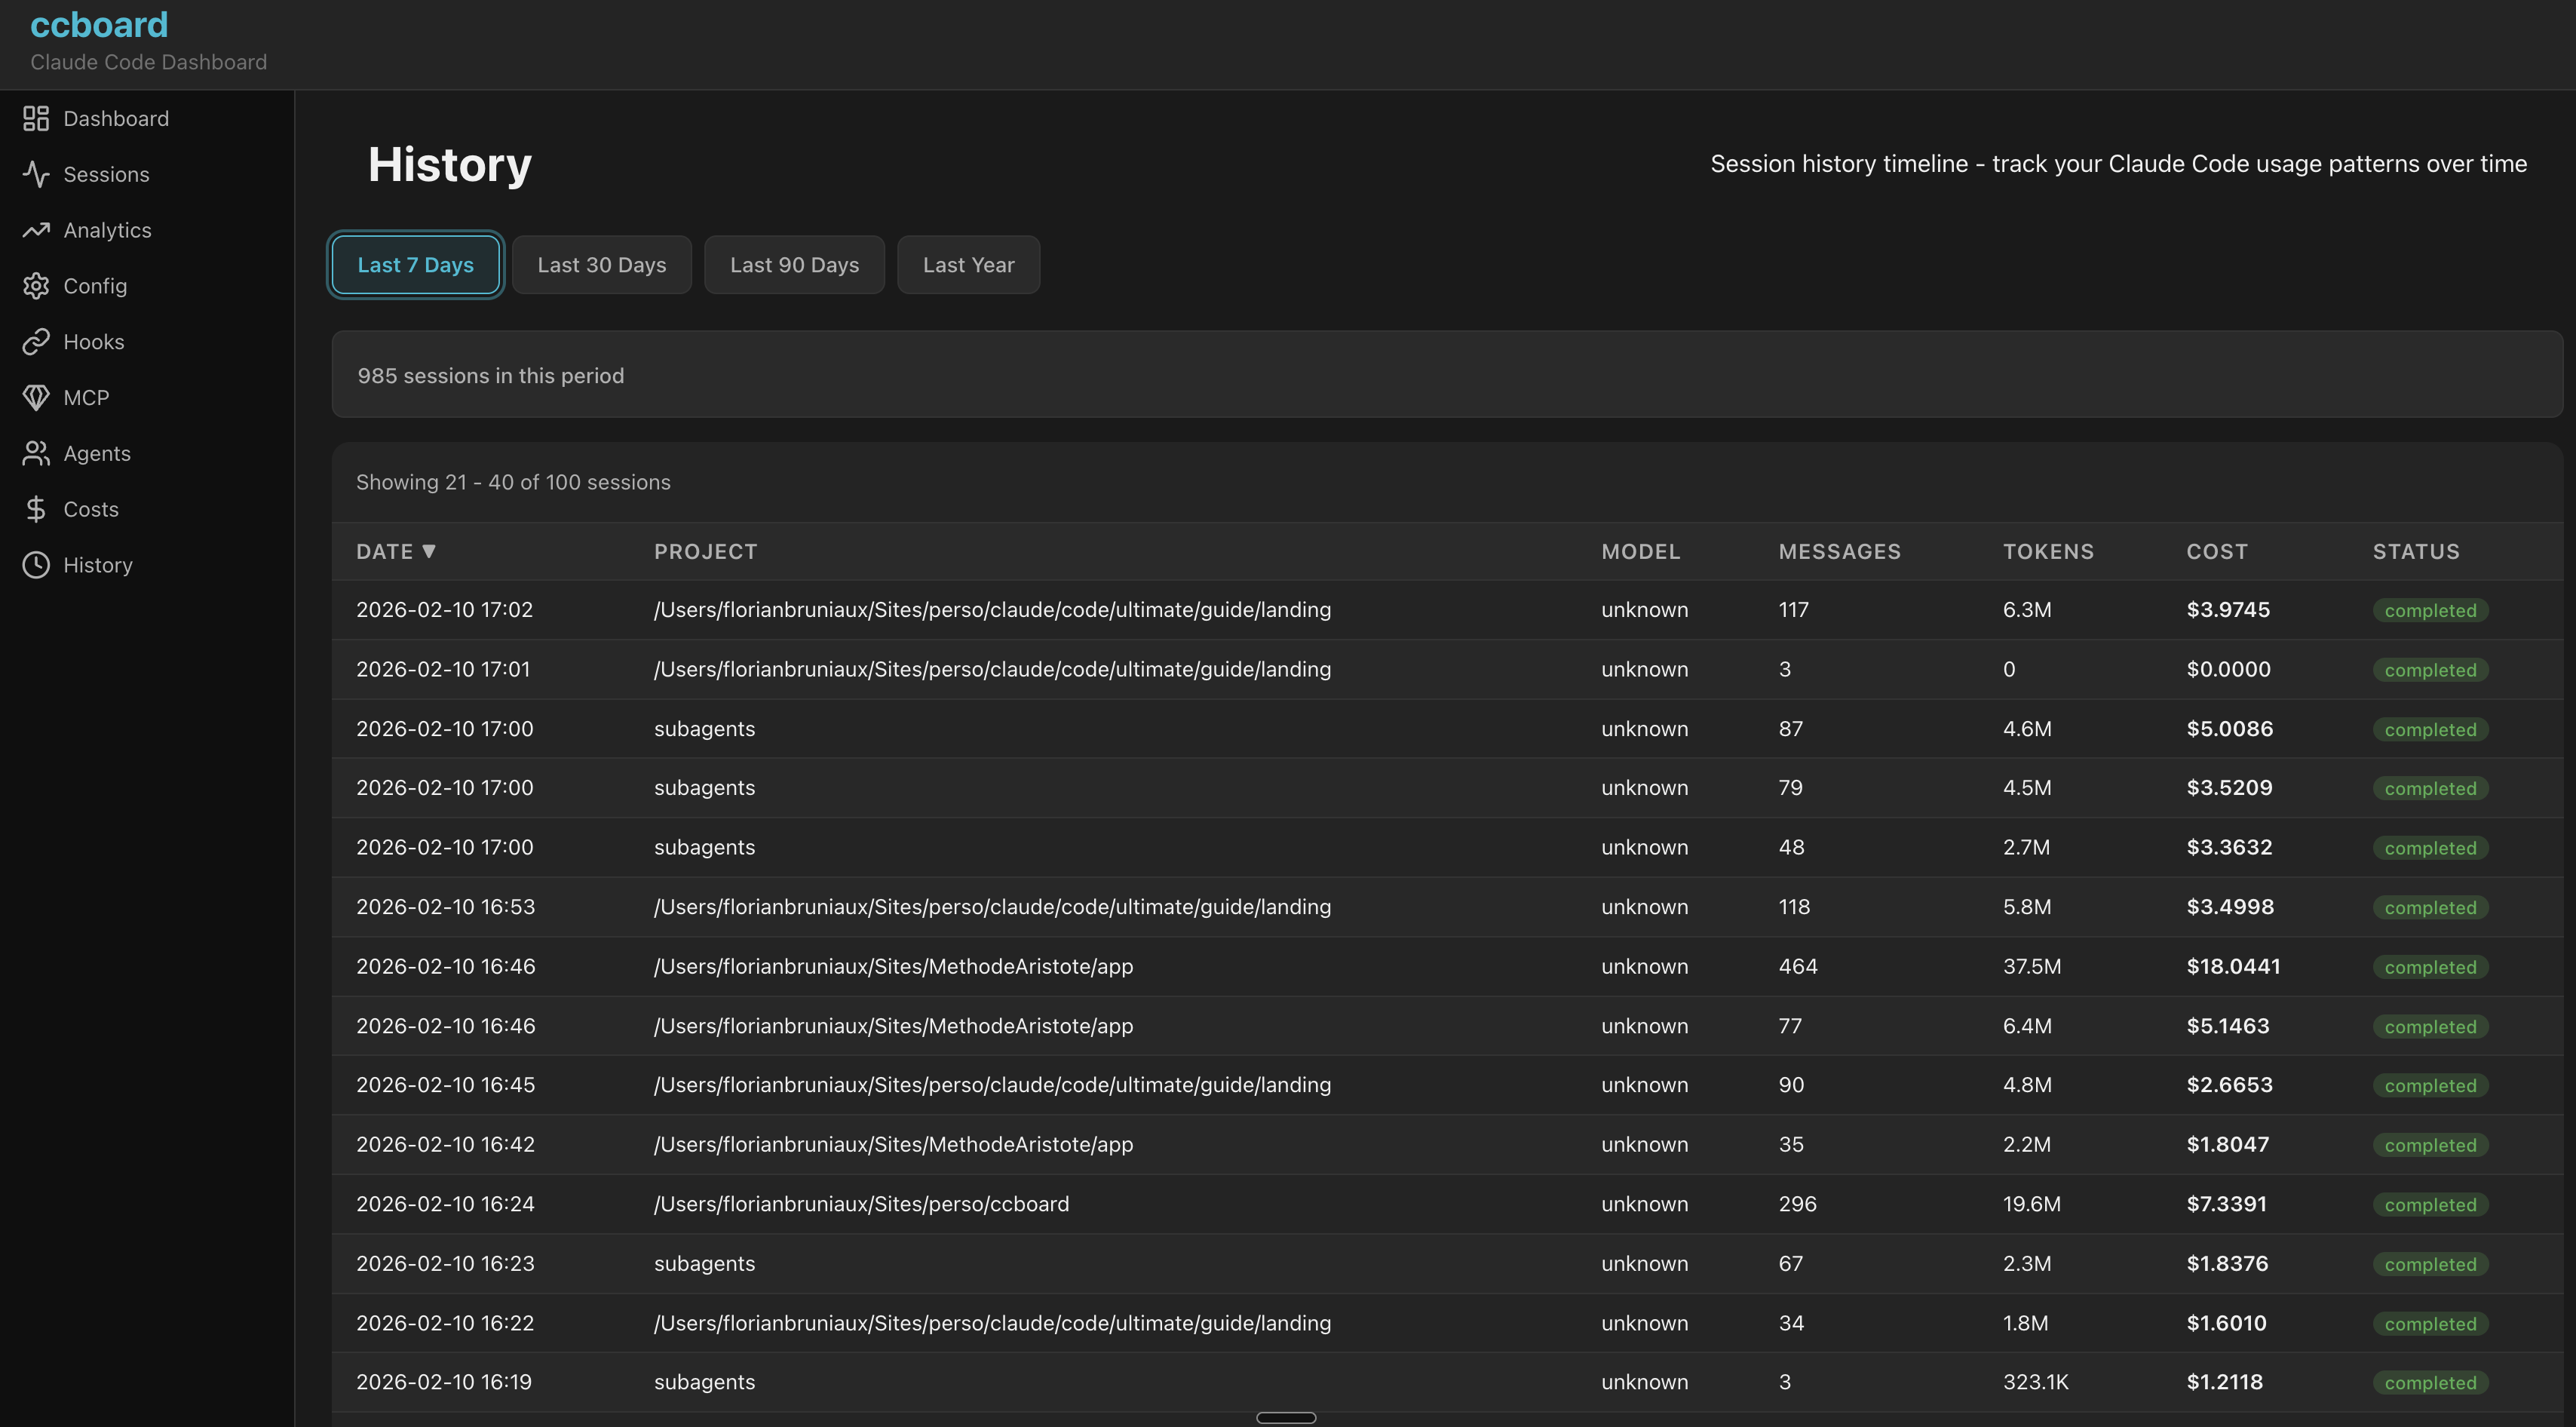
Timeline view of all Claude Code activities
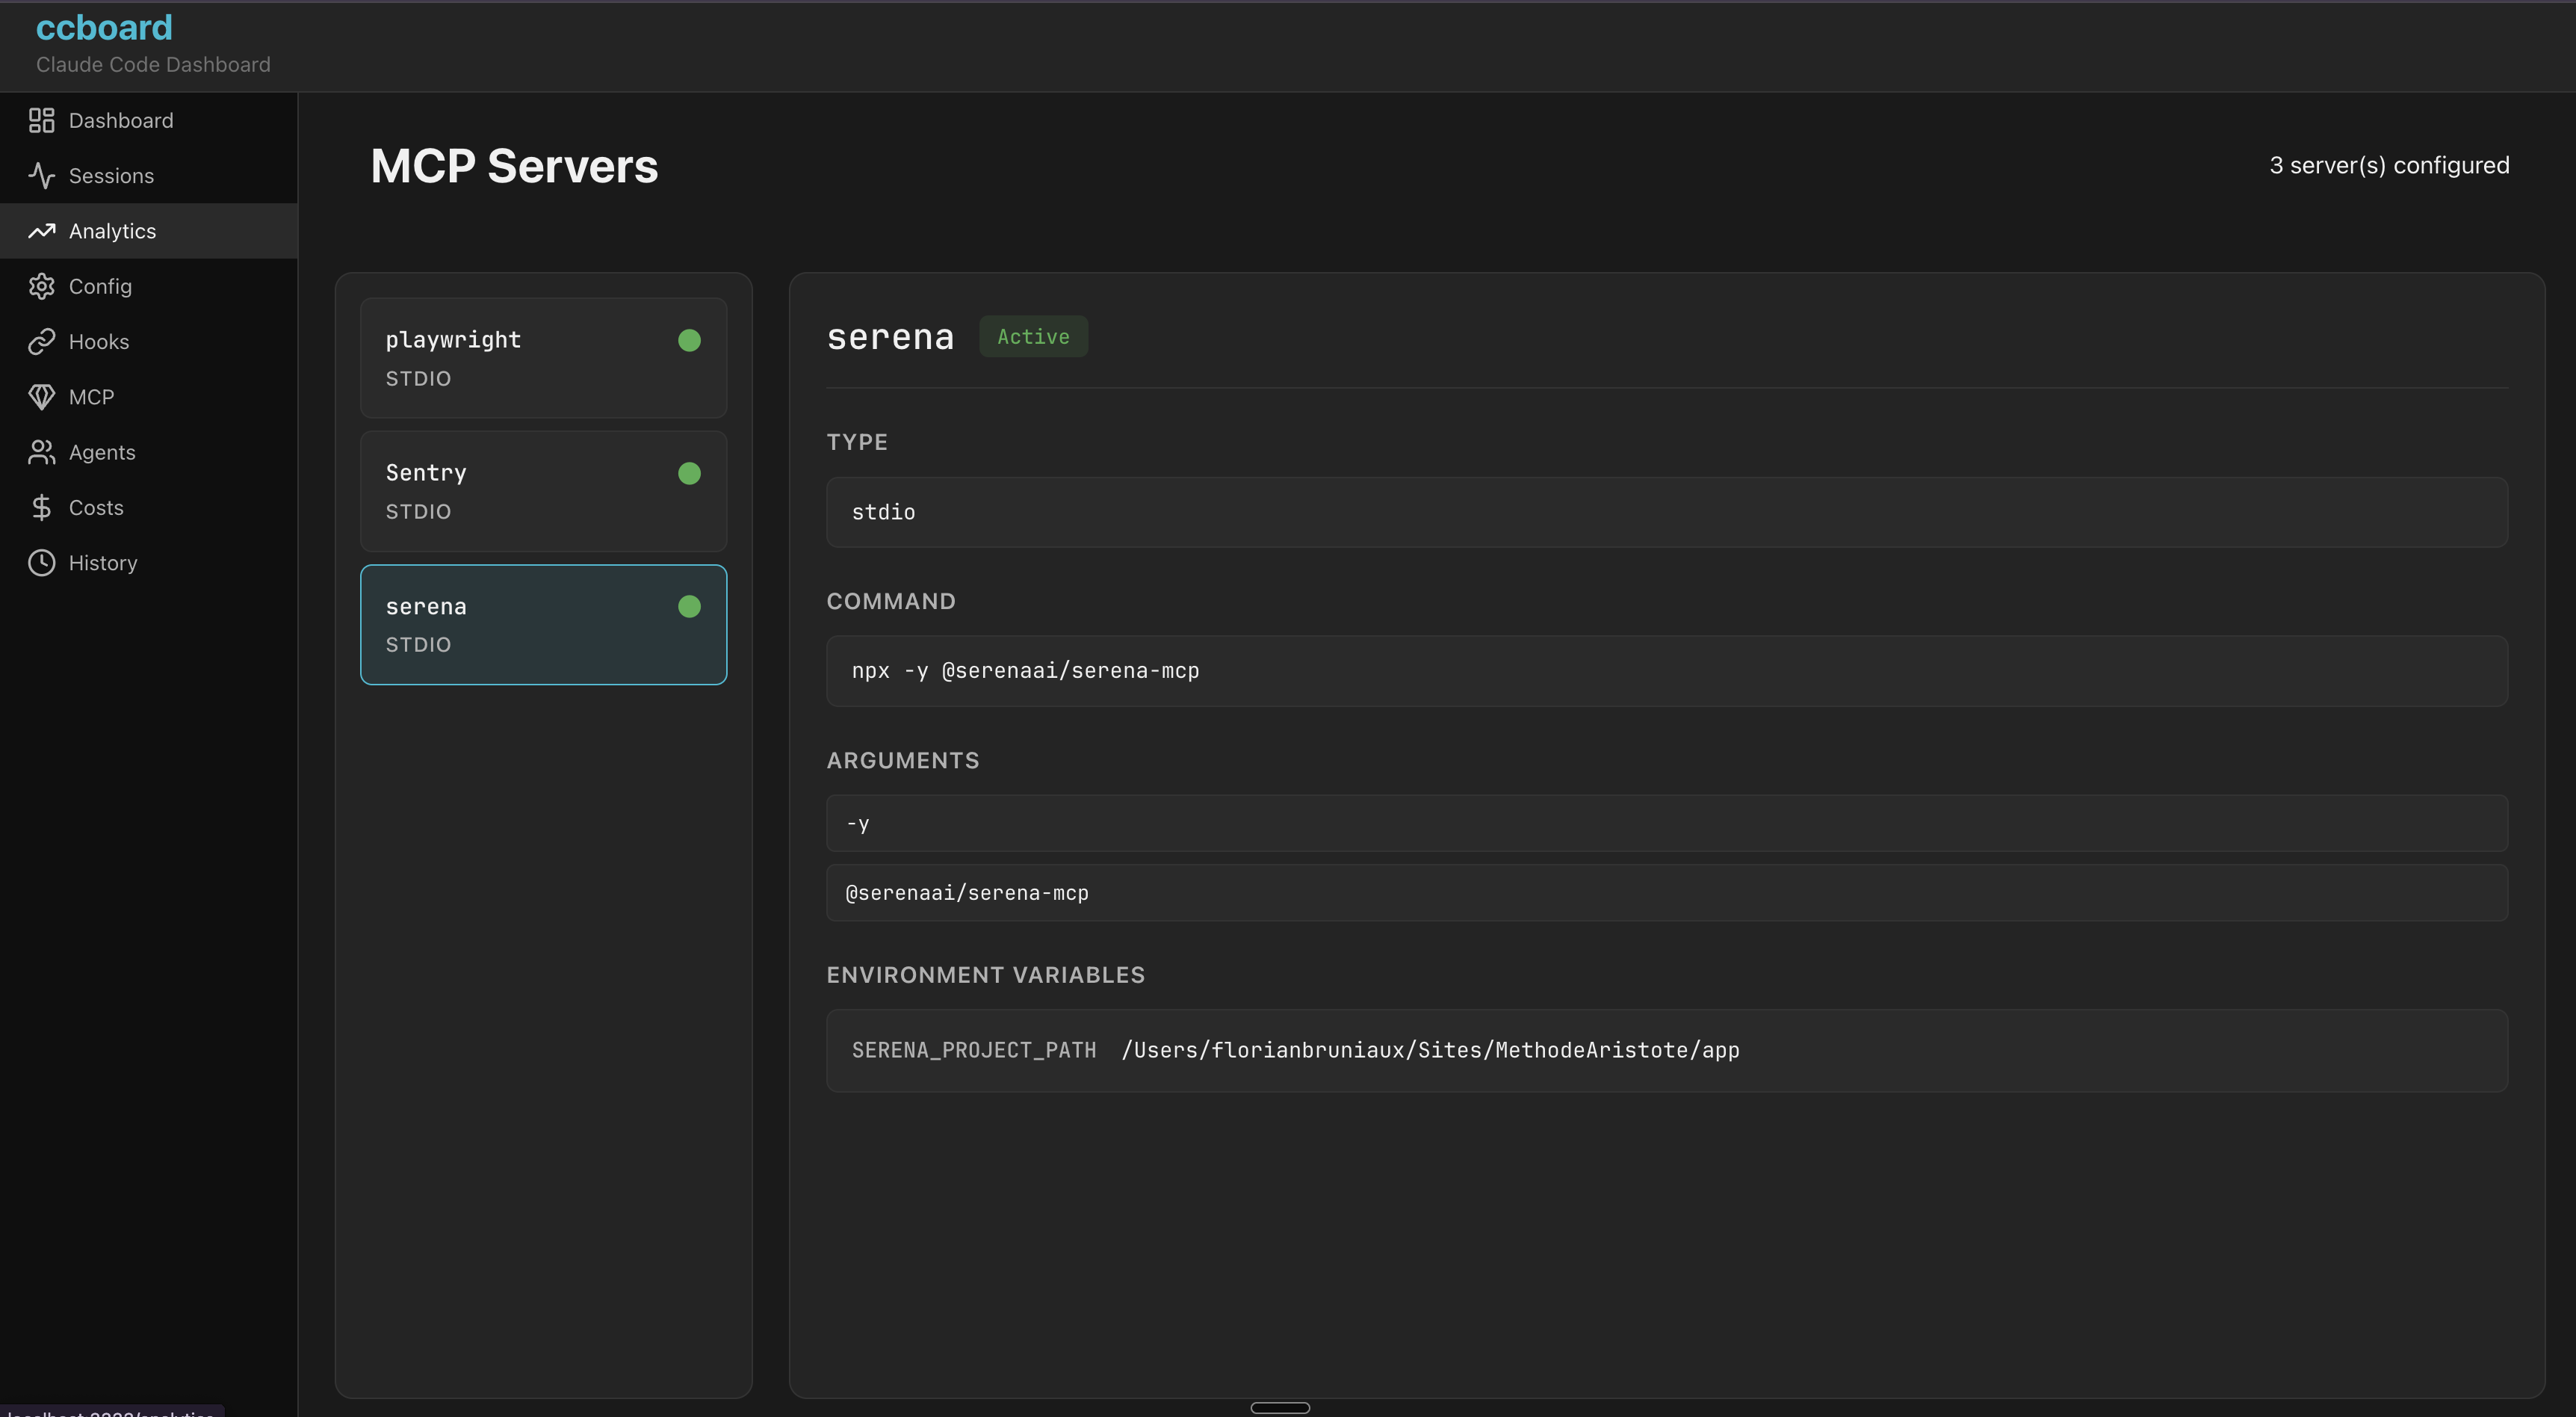
MCP server monitoring with real-time status
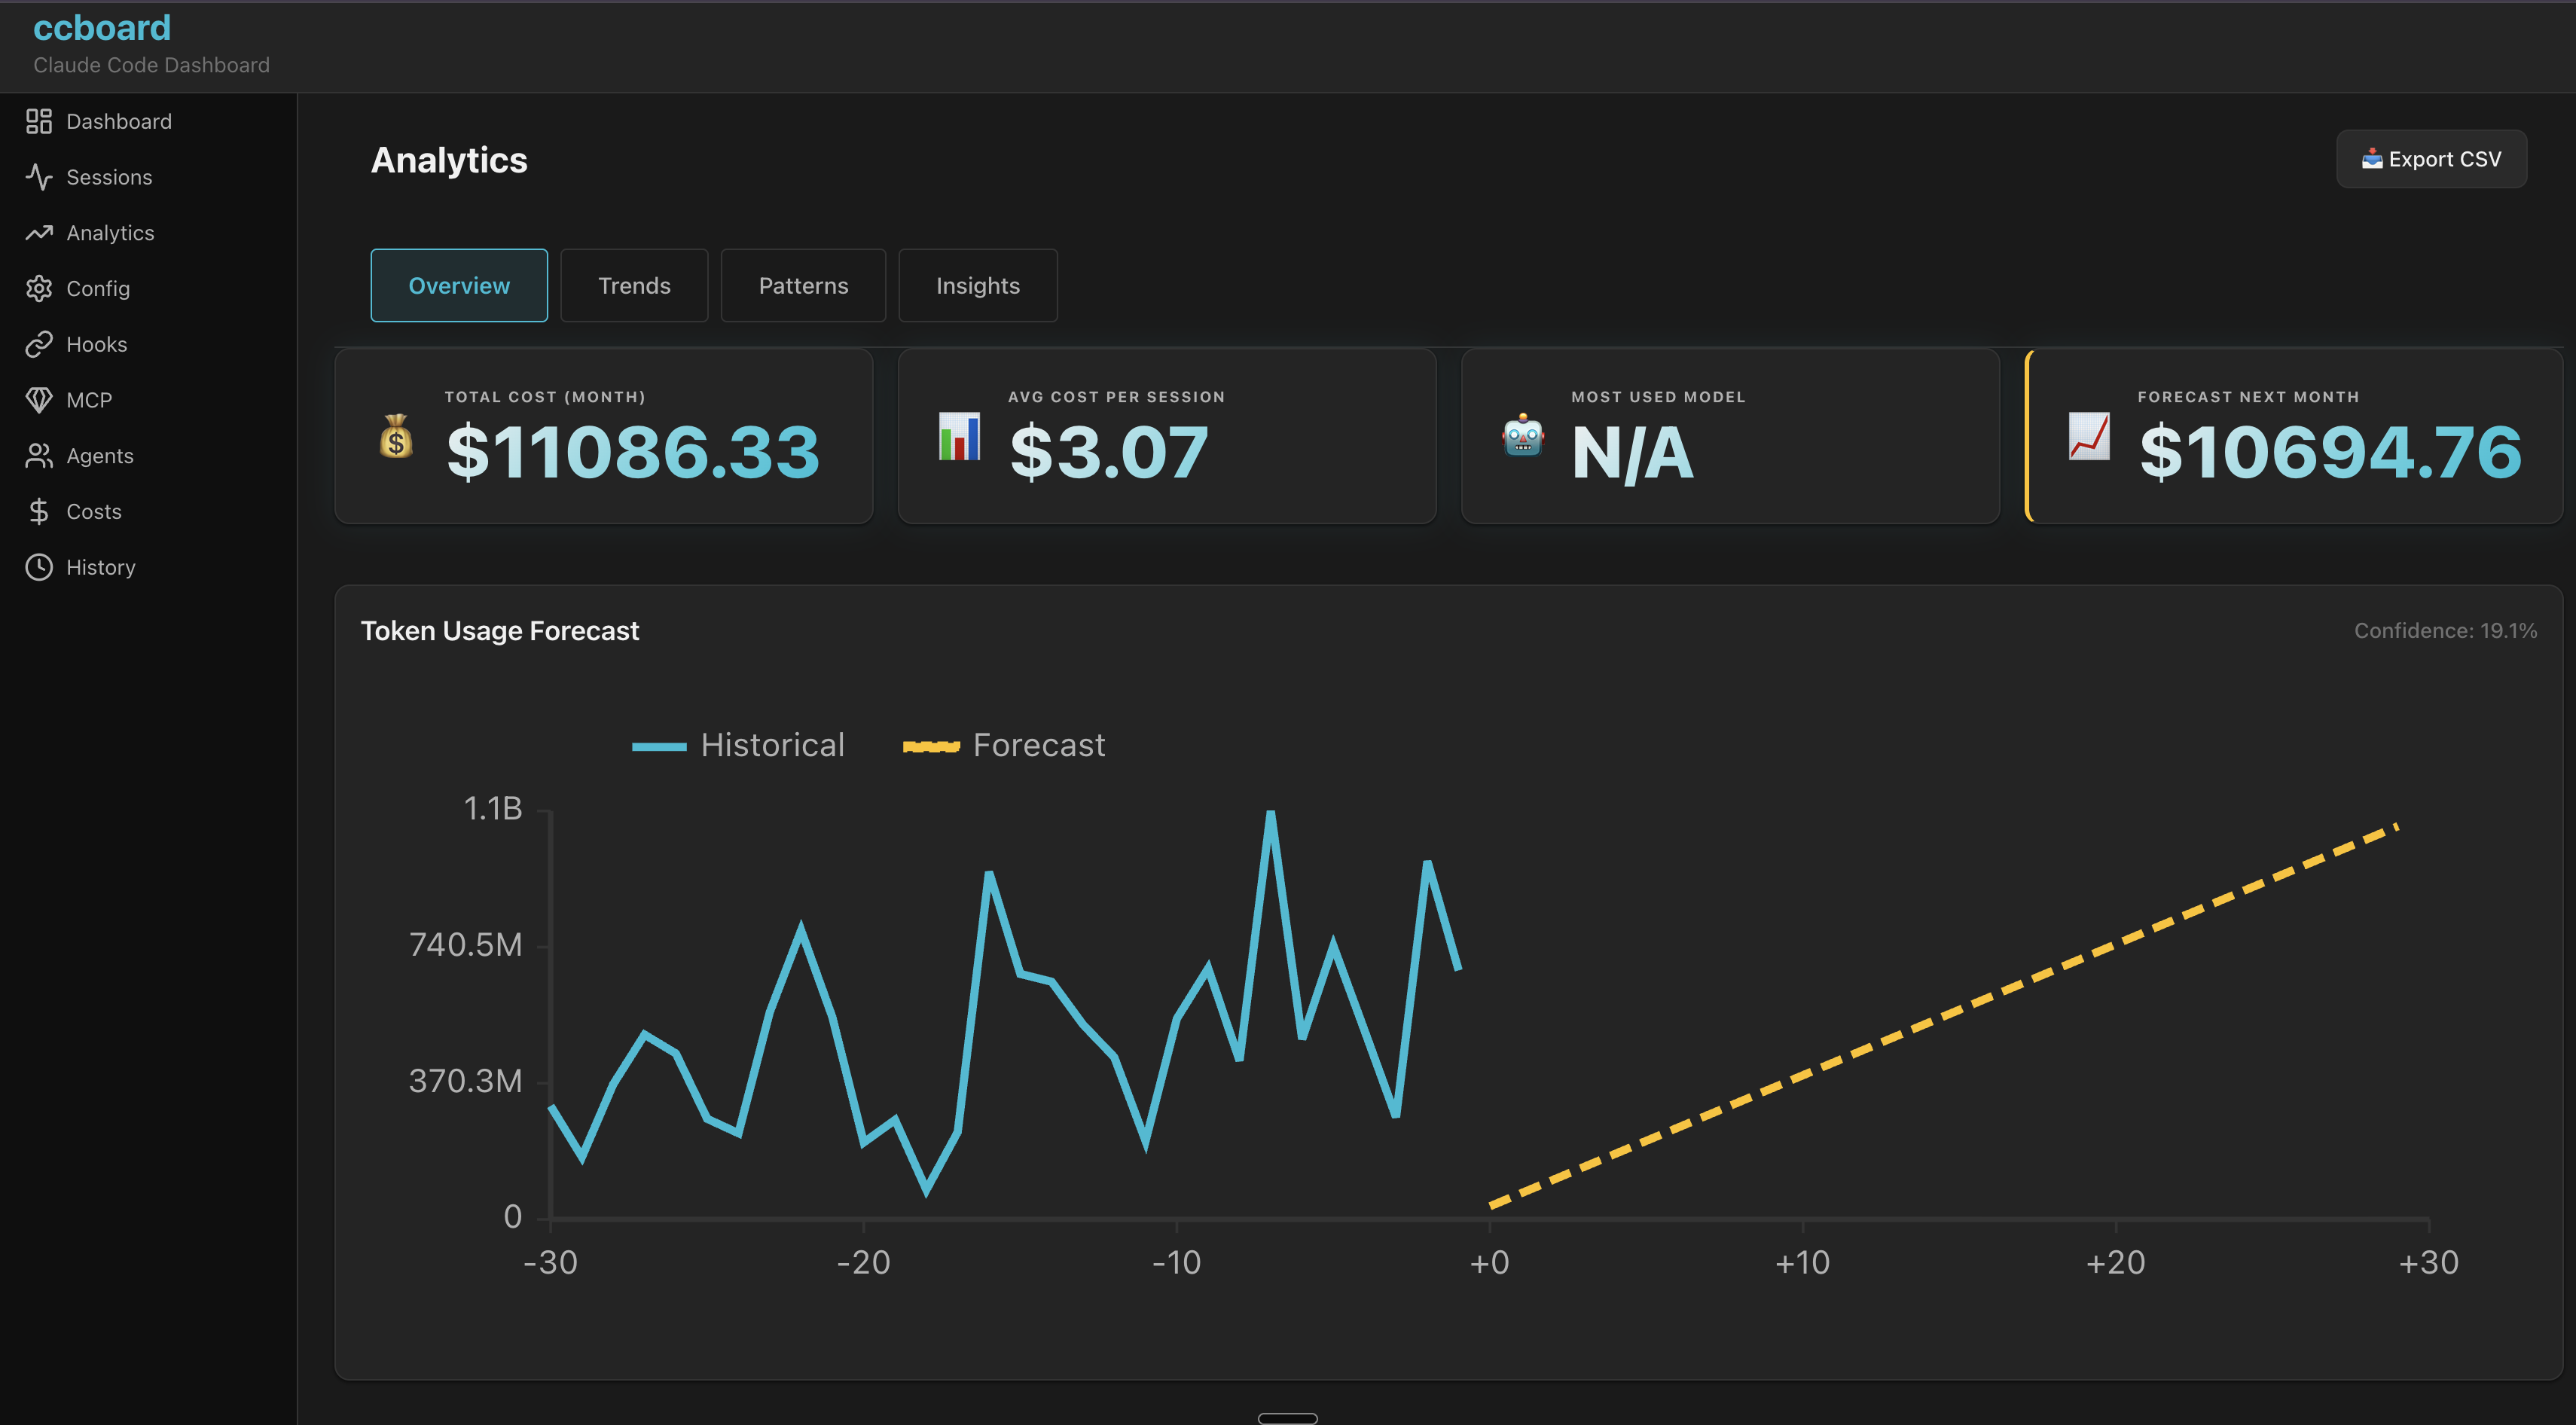
Advanced analytics with forecasting and insights
Learning Paths
Choose your path based on your needs and available time
⚡ Quick Start (5 min) - Get running immediately
- Install:
brew tap FlorianBruniaux/tap && brew install ccboard - Launch TUI:
ccboard - Navigate: Use 1-9 to jump between tabs, Tab to cycle
- Explore: Dashboard (tab 1) for overview, Sessions (tab 2) for recent activity
Goal: See your Claude Code stats and sessions in under 5 minutes
📊 Session Monitoring (10 min) - Track live Claude processes
- Sessions tab (2): See all your sessions with live process monitoring
- Live processes: Active Claude sessions show CPU/RAM/Tokens in real-time
- Search: Press / to search sessions by content or project
- Detail view: Press Enter for full session metadata (17 fields)
- CLI search:
ccboard search "bug fix"
Goal: Monitor active sessions and search historical activity
⚙️ Configuration & Budget (15 min) - Customize your setup
- Config tab (8): See 4-column diff (global/project/local/merged)
- Set plan:
{"subscriptionPlan": "max20x"} - Budget alerts:
{"budget": {"monthlyBudgetUsd": 50.0, "alertThresholdPct": 80.0}} - Costs tab (4): See budget status with visual warnings (green/yellow/red)
- Hooks tab (9): Test your hooks with syntax highlighting
Goal: Configure subscription plan and set up budget alerts
🚀 Power Users (30 min) - Master advanced features
- CLI workflow:
ccboard recent 10 --json - Resume sessions:
ccboard resume <id> - Analytics (tab 3): 30-day forecasting, usage patterns, session duration stats
- Export data: History tab → CSV/JSON export for analysis
- Web interface:
ccboard web --port 3333 - Dual mode:
ccboard both --port 3333 - Env vars:
CCBOARD_FORMAT=json ccboard stats
Goal: Integrate ccboard into your workflow with CLI, web interface, and automation
Why ccboard?
The only actively-maintained Rust TUI+Web dashboard combining Claude Code monitoring, conversation viewer, config management, hooks, agents, and MCP servers in a single binary.
| Feature | ccboard | agtrace | claudelytics | ccusage |
|---|---|---|---|---|
| Status | ✅ Active | ✅ Active | 🔴 Stale 6m | ✅ Active |
| Stars | 0 | 23 | 62 | 10,361 |
| Language | Rust | Rust | Rust | TypeScript |
| Type | TUI+Web | TUI | TUI | CLI |
| TUI Dashboard | ✅ 13 tabs | ✅ Single view | ✅ 8 tabs | ❌ |
| Config Viewer (4-level) | ✅ | ❌ | ❌ | ❌ |
| Hooks Viewer + Test | ✅ | ❌ | ❌ | ❌ |
| Agents Browser | ✅ | ❌ | ❌ | ❌ |
| MCP Status Detection | ✅ | ❌ | ❌ | ❌ |
| SQLite Cache (89x) | ✅ | ✅ Pointer | ❌ | ❌ |
| Export CSV/JSON | ✅ | ❌ | ✅ | ✅ JSON |
| Live File Watcher | ✅ | ✅ Poll 1s | ❌ | ❌ |
| Advanced Analytics | ✅ 4 views | ❌ | ⚠️ Burn rate | ❌ |
| Budget / Quota Management | ✅ 4-level alerts | ❌ | ❌ | ❌ |
| Single Binary (TUI+Web) | ✅ Rust | ✅ Rust | ✅ Rust | ❌ npm |
Unique to ccboard
- • Only multi-concern dashboard (config + hooks + agents + MCP + analytics)
- • Config 4-level merge viewer (global/project/local/env)
- • Hooks syntax highlighting + test mode
- • Agents/Commands/Skills browser with invocation stats
- • MCP server status detection
- • SQLite metadata cache (89x faster startup)
- • Advanced Analytics: 30-day forecasting, session duration stats, activity patterns
- • Monthly budget limits with 4-level quota system (Safe → Warning → Critical → Exceeded) and MTD cost tracking
- • Conversation Viewer: JSONL replay, tool call visualization, regex search, HTML export
- • Dual TUI + Web in single binary
Dive Deeper
Explore the full documentation to get the most out of ccboard.
Getting Started →
Install, launch, and navigate ccboard in under 2 minutes.
12 Tabs Guide →
Deep dive into each tab: Dashboard, Sessions, Analytics, Search, and more.
Configuration →
4-level config merge (global/project/local/env), environment variables, and CLI options.
CLI Commands →
search, recent, info, resume, stats, and more.
Web Interface →
100% feature parity with TUI. SSE live updates, responsive.
Performance →
SQLite cache, 89x speedup, mtime invalidation explained.
Quick Start
Get started in 30 seconds:
Recommended: Homebrew
brew tap FlorianBruniaux/tap
brew install ccboard
macOS & Linux users: Fastest installation method with automatic updates
Alternative: cargo install
cargo install ccboardRequirements: Rust 1.85+ (Claude Code users already have Rust installed)
Pre-built binaries: Available from GitHub Releases
Launch Dashboard
# TUI (default)
ccboard

# Web interface
ccboard web --port 3333

# Both TUI + Web
ccboard both --port 3333

# Stats summary
ccboard stats
CLI Commands
# Session management
ccboard search "query"       # Search sessions by content
ccboard recent 10            # Show 10 most recent sessions
ccboard info <session-id>    # Display detailed session metadata
ccboard resume <session-id>  # Resume session in Claude CLI

# Maintenance
ccboard clear-cache          # Clear SQLite cache (after upgrades)
All commands support JSON output: ccboard recent 10 --json
Keybindings
# Navigation
1-9        Jump to specific tab
Tab        Next tab
j/k        Move down/up (vim style)
/          Search (Sessions, History)
:          Command palette

# File operations
e          Edit file in $EDITOR
o          Reveal in file manager

# Theme
Ctrl+T     Toggle Light/Dark mode (persistent)

# Other
r          Refresh data
?          Show help
q          Quit
Environment Variables
For automation and CI/CD workflows:
| Variable | Description | Example |
|---|---|---|
CCBOARD_CLAUDE_HOME | Override Claude home directory | CCBOARD_CLAUDE_HOME=/custom/path ccboard |
CCBOARD_NON_INTERACTIVE | Disable interactive prompts (CI/CD mode) | CCBOARD_NON_INTERACTIVE=1 ccboard stats |
CCBOARD_FORMAT | Force output format: json or table | CCBOARD_FORMAT=json ccboard recent 10 |
CCBOARD_NO_COLOR | Disable ANSI colors (log-friendly) | CCBOARD_NO_COLOR=1 ccboard search "bug" |
# CI/CD: JSON output without colors
CCBOARD_NON_INTERACTIVE=1 CCBOARD_NO_COLOR=1 CCBOARD_FORMAT=json ccboard stats

# Log-friendly: No colors for file redirects
CCBOARD_NO_COLOR=1 ccboard recent 50 > sessions.log